## Chart: Receiver Operating Characteristic (ROC) Curves
### Overview
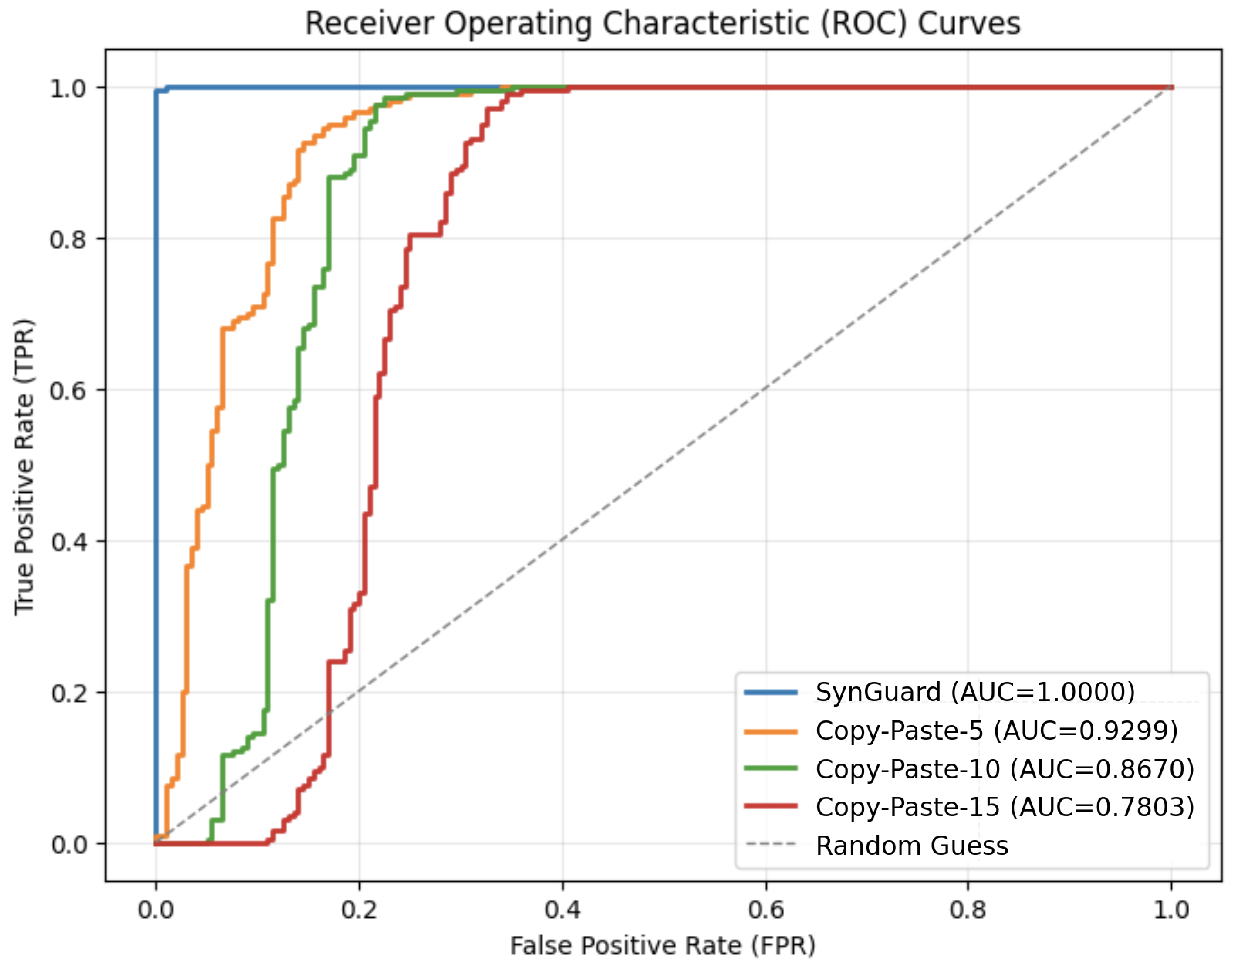
The image displays Receiver Operating Characteristic (ROC) curves for several models: SynGuard, Copy-Paste-5, Copy-Paste-10, and Copy-Paste-15, alongside a diagonal line representing a random guess. The curves plot the True Positive Rate (TPR) against the False Positive Rate (FPR) to evaluate the performance of each model in distinguishing between positive and negative cases.
### Components/Axes
* **Title:** Receiver Operating Characteristic (ROC) Curves
* **X-axis:** False Positive Rate (FPR) - Scale: 0.0 to 1.0
* **Y-axis:** True Positive Rate (TPR) - Scale: 0.0 to 1.0
* **Legend:** Located in the bottom-right corner. Contains the following entries:
* SynGuard (Blue, solid line) - AUC = 1.0000
* Copy-Paste-5 (Orange, solid line) - AUC = 0.9299
* Copy-Paste-10 (Green, solid line) - AUC = 0.8670
* Copy-Paste-15 (Red, dashed line) - AUC = 0.7803
* Random Guess (Gray, dashed line)
### Detailed Analysis
* **SynGuard (Blue):** The curve starts at (0.0, 0.0) and rapidly rises to (approximately 0.1, 1.0), maintaining a TPR of 1.0 for the remainder of the FPR range. This indicates perfect discrimination.
* **Copy-Paste-5 (Orange):** The curve begins at (0.0, 0.0) and rises to approximately (0.2, 0.9). It then plateaus and gradually decreases as FPR increases.
* **Copy-Paste-10 (Green):** The curve starts at (0.0, 0.0) and rises to approximately (0.3, 0.8). It then exhibits a more gradual increase and plateaus at a lower TPR than Copy-Paste-5.
* **Copy-Paste-15 (Red):** The curve starts at (0.0, 0.0) and rises to approximately (0.4, 0.7). It shows a more moderate slope and remains below the other curves.
* **Random Guess (Gray):** A diagonal line from (0.0, 0.0) to (1.0, 1.0). Represents the performance of a classifier that randomly guesses.
Approximate Data Points (extracted visually):
| FPR | SynGuard (TPR) | Copy-Paste-5 (TPR) | Copy-Paste-10 (TPR) | Copy-Paste-15 (TPR) |
| :---- | :------------- | :----------------- | :------------------ | :------------------ |
| 0.0 | 0.0 | 0.0 | 0.0 | 0.0 |
| 0.1 | 1.0 | 0.6 | 0.4 | 0.2 |
| 0.2 | 1.0 | 0.9 | 0.8 | 0.4 |
| 0.3 | 1.0 | 0.95 | 0.85 | 0.5 |
| 0.4 | 1.0 | 0.98 | 0.9 | 0.7 |
| 0.5 | 1.0 | 0.99 | 0.95 | 0.8 |
| 0.6 | 1.0 | 1.0 | 0.98 | 0.85 |
| 0.7 | 1.0 | 1.0 | 1.0 | 0.9 |
| 0.8 | 1.0 | 1.0 | 1.0 | 0.95 |
| 0.9 | 1.0 | 1.0 | 1.0 | 1.0 |
| 1.0 | 1.0 | 1.0 | 1.0 | 1.0 |
### Key Observations
* SynGuard exhibits perfect classification performance (AUC = 1.0).
* The performance of the Copy-Paste models degrades as the number of pasted copies increases (AUC decreases from 0.9299 to 0.7803).
* All models perform better than random guessing.
* The Copy-Paste-5 model shows the best performance among the Copy-Paste variants.
### Interpretation
The ROC curves demonstrate the effectiveness of each model in distinguishing between positive and negative instances. SynGuard clearly outperforms all other models, achieving perfect separation. The Copy-Paste models show diminishing returns as the number of pasted copies increases, suggesting that the added copies introduce more noise or ambiguity. The Area Under the Curve (AUC) values quantify this performance, with higher AUC values indicating better discrimination ability. The random guess line serves as a baseline, and all models surpass it, indicating that they are all capable of performing better than chance. The curves suggest that SynGuard is a highly reliable classifier, while the Copy-Paste models offer varying degrees of performance, with Copy-Paste-5 being the most effective. The decreasing AUC values for the Copy-Paste models could be due to the introduction of errors or inconsistencies with each additional copy-paste operation.