## Grid Diagram: Forest and Field Layout
### Overview
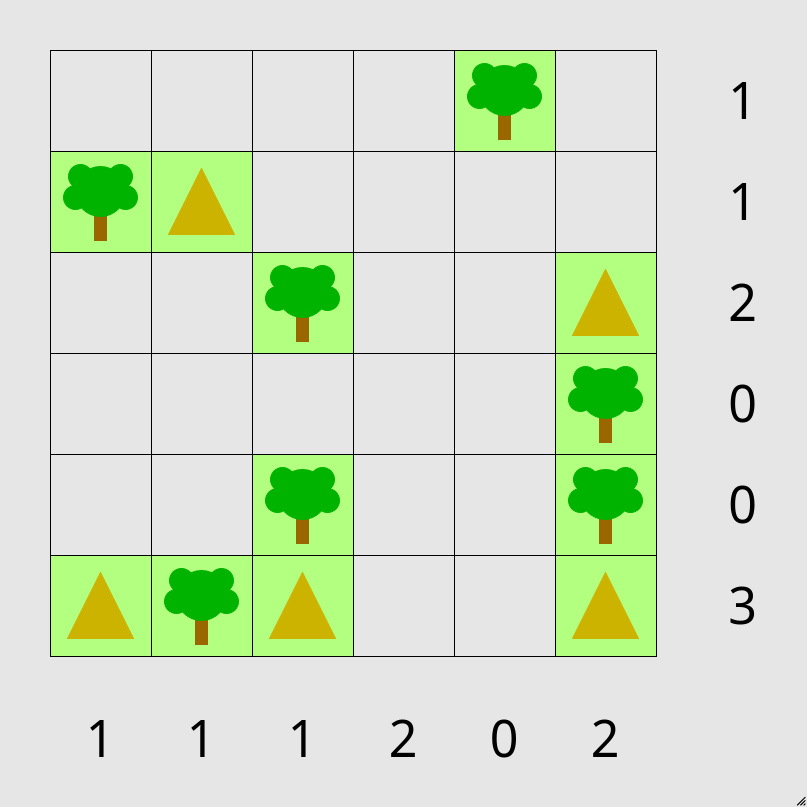
The image is a grid diagram representing a landscape with trees and fields. The grid is 6x6, with the x-axis labeled along the bottom and the y-axis labeled along the right. The grid cells contain either a tree icon, a triangle icon, or are empty. The x-axis labels are 1, 1, 1, 2, 0, 2. The y-axis labels are 1, 1, 2, 0, 0, 3.
### Components/Axes
* **Grid:** 6x6 grid with light gray background.
* **X-axis Labels:** Located at the bottom of the grid, with values 1, 1, 1, 2, 0, 2.
* **Y-axis Labels:** Located on the right side of the grid, with values 1, 1, 2, 0, 0, 3.
* **Tree Icon:** Represents a tree, colored green.
* **Triangle Icon:** Represents a field, colored gold.
* **Light Green Cells:** Some cells have a light green background, indicating a specific area.
### Detailed Analysis or ### Content Details
The grid contains the following elements:
* **Row 1 (Y=1):**
* Column 1 (X=1): Tree icon in a light green cell.
* Column 2 (X=1): Triangle icon in a light green cell.
* Column 5 (X=0): Tree icon.
* **Row 2 (Y=1):** Empty.
* **Row 3 (Y=2):**
* Column 3 (X=1): Tree icon.
* Column 6 (X=2): Triangle icon in a light green cell.
* **Row 4 (Y=0):**
* Column 6 (X=2): Tree icon.
* **Row 5 (Y=0):**
* Column 3 (X=1): Tree icon.
* Column 6 (X=2): Tree icon.
* **Row 6 (Y=3):**
* Column 1 (X=1): Triangle icon in a light green cell.
* Column 2 (X=1): Tree icon in a light green cell.
* Column 3 (X=1): Triangle icon in a light green cell.
### Key Observations
* Trees and triangles are placed in specific cells, some with a light green background.
* The x and y axis labels have values ranging from 0 to 3.
* The distribution of trees and triangles is not uniform across the grid.
### Interpretation
The diagram likely represents a simplified model of a landscape, where trees and fields are distributed according to some underlying rule or pattern. The x and y axis labels could represent coordinates or some other spatial information. The light green cells might indicate areas of particular interest or significance. The data suggests a non-random distribution of trees and fields, possibly reflecting environmental factors or human intervention. The diagram could be used to visualize and analyze the spatial relationships between different landscape elements.