## Line Chart: Cost per Sequence vs. Sequence Number
### Overview
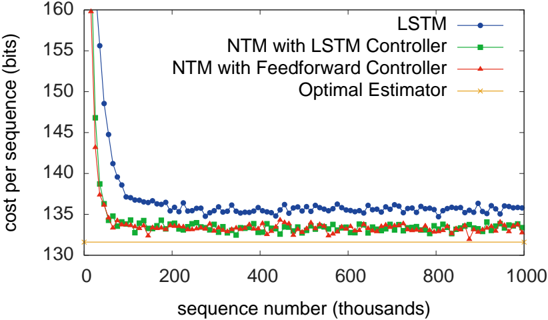
The image is a line chart comparing the cost per sequence (in bits) for different models (LSTM, NTM with LSTM Controller, NTM with Feedforward Controller, and Optimal Estimator) over a sequence number ranging from 0 to 1000 (thousands). The chart illustrates the performance of these models as the sequence number increases.
### Components/Axes
* **X-axis:** Sequence number (thousands), ranging from 0 to 1000 in increments of 200.
* **Y-axis:** Cost per sequence (bits), ranging from 130 to 160 in increments of 5.
* **Legend (Top-Right):**
* Blue line with circles: LSTM
* Green line with squares: NTM with LSTM Controller
* Red line with triangles: NTM with Feedforward Controller
* Yellow line with crosses: Optimal Estimator
### Detailed Analysis
* **LSTM (Blue):** The LSTM line starts at approximately 159 bits and rapidly decreases to around 136 bits by sequence number 200 (thousands). After that, it fluctuates between 134 and 137 bits, remaining relatively stable.
* (0, 159)
* (200, 136)
* (1000, 135)
* **NTM with LSTM Controller (Green):** The NTM with LSTM Controller line starts at approximately 159 bits and decreases to around 133 bits by sequence number 100 (thousands). It then fluctuates between 132 and 134 bits for the rest of the sequence.
* (0, 159)
* (100, 133)
* (1000, 133)
* **NTM with Feedforward Controller (Red):** The NTM with Feedforward Controller line starts at approximately 159 bits and decreases to around 133 bits by sequence number 100 (thousands). It then fluctuates between 132 and 134 bits for the rest of the sequence.
* (0, 159)
* (100, 133)
* (1000, 133)
* **Optimal Estimator (Yellow):** The Optimal Estimator line remains constant at approximately 131 bits throughout the entire sequence.
* (0, 131)
* (1000, 131)
### Key Observations
* The LSTM model has a higher initial cost per sequence but stabilizes after the sequence number reaches 200 (thousands).
* The NTM with LSTM Controller and NTM with Feedforward Controller models have similar performance, with a lower cost per sequence than LSTM after the initial drop.
* The Optimal Estimator consistently has the lowest cost per sequence.
* All models show a significant decrease in cost per sequence in the initial phase (sequence number < 200 thousands).
### Interpretation
The chart demonstrates the learning curves of different models in terms of cost per sequence. The LSTM model initially performs worse but converges to a stable cost. The NTM models with LSTM and Feedforward controllers perform similarly and better than LSTM after the initial phase. The Optimal Estimator provides a baseline with the lowest cost, indicating the theoretical limit of performance. The initial drop in cost for all models suggests a rapid learning phase, after which the models stabilize. The data suggests that NTM with either LSTM or Feedforward controllers are more efficient than LSTM for this particular task, but none can outperform the Optimal Estimator.