## Line Graph: Cost per Sequence vs. Sequence Number
### Overview
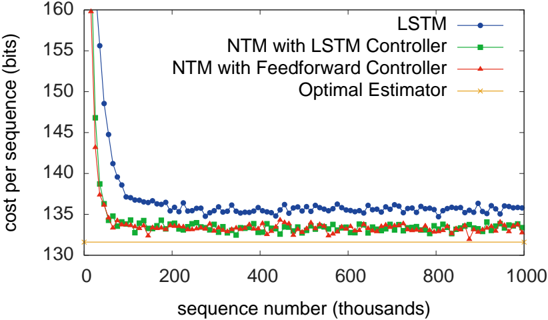
The image is a line graph comparing the cost per sequence (in bits) across four different methods: LSTM, NTM with LSTM Controller, NTM with Feedforward Controller, and Optimal Estimator. The x-axis represents sequence numbers (in thousands), and the y-axis represents cost per sequence (in bits). All four methods show a sharp decline in cost during the initial sequences, followed by stabilization.
### Components/Axes
- **X-axis**: "sequence number (thousands)" with ticks at 0, 200, 400, 600, 800, and 1000.
- **Y-axis**: "cost per sequence (bits)" with ticks from 130 to 160 in increments of 5.
- **Legend**:
- **Blue circles**: LSTM
- **Green squares**: NTM with LSTM Controller
- **Red triangles**: NTM with Feedforward Controller
- **Yellow crosses**: Optimal Estimator
### Detailed Analysis
1. **LSTM (Blue Circles)**:
- Starts at approximately **160 bits** at sequence 0.
- Drops sharply to **~135 bits** by sequence 200.
- Fluctuates slightly between **134–136 bits** for sequences 400–1000.
2. **NTM with LSTM Controller (Green Squares)**:
- Begins at ~**155 bits** at sequence 0.
- Declines to **~135 bits** by sequence 200.
- Stabilizes with minor fluctuations between **134–136 bits** for later sequences.
3. **NTM with Feedforward Controller (Red Triangles)**:
- Starts at ~**150 bits** at sequence 0.
- Drops to **~135 bits** by sequence 200.
- Remains stable with minor oscillations between **134–136 bits**.
4. **Optimal Estimator (Yellow Crosses)**:
- Maintains a **constant value of ~130 bits** across all sequences.
### Key Observations
- All methods except the Optimal Estimator exhibit a steep initial decline in cost, converging to similar values (~135 bits) after sequence 200.
- The Optimal Estimator consistently achieves the lowest cost (~130 bits), outperforming other methods by ~5 bits.
- The LSTM method has the highest initial cost but the fastest drop-off.
- No significant outliers or anomalies are observed in the data.
### Interpretation
The graph demonstrates that the **Optimal Estimator** is the most efficient method, maintaining the lowest cost per sequence throughout. The other methods (LSTM, NTM with LSTM Controller, and NTM with Feedforward Controller) start with higher costs but converge to similar performance levels after the initial sequences. This suggests that while the Optimal Estimator is ideal for minimizing cost, the other methods may still be viable alternatives with comparable long-term efficiency. The sharp initial decline in cost for non-optimal methods indicates potential inefficiencies in early sequence processing that stabilize over time.