## Chart Type: Importance Score vs. Reasoning Step
### Overview
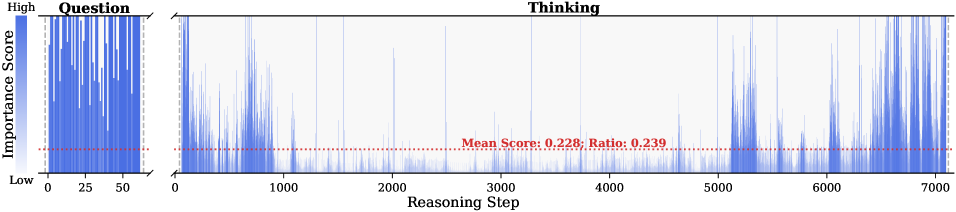
The image presents a chart that visualizes the importance score over reasoning steps, split into two sections: "Question" and "Thinking". The "Question" section shows the importance score for the initial question, while the "Thinking" section displays the importance score across a series of reasoning steps. A red dotted line indicates the mean score and ratio for the "Thinking" section.
### Components/Axes
* **Title:** "Thinking" (located at the top-center of the chart)
* **Y-axis Label:** "Importance Score" (vertical, on the left side)
* Scale: "High" at the top, "Low" at the bottom. A gradient bar visually represents the scale.
* **X-axis Label:** "Reasoning Step" (horizontal, at the bottom)
* Scale: 0 to 7000, with markers at 0, 1000, 2000, 3000, 4000, 5000, 6000, and 7000.
* **Question Section:** Located on the left side of the chart.
* Title: "Question" (at the top)
* X-axis: 0 to 50, with markers at 0, 25, and 50.
* **Mean Score and Ratio:** "Mean Score: 0.228; Ratio: 0.239" (located in the middle of the "Thinking" section, slightly above the red dotted line)
* **Data Series:** Represented by blue vertical lines.
### Detailed Analysis
* **Question Section:**
* The importance score fluctuates significantly between "Low" and "High" across the 50 steps.
* The values appear to be densely packed, making precise individual readings difficult.
* **Thinking Section:**
* The importance score varies across the 7000 reasoning steps.
* The score is generally lower between steps 1000 and 5000 compared to the beginning and end.
* There are several spikes where the importance score reaches higher values, particularly near the beginning and end of the reasoning steps.
* The red dotted line, representing the mean score (0.228) and ratio (0.239), provides a reference point for the average importance score.
### Key Observations
* The "Question" section shows a high degree of variability in importance scores.
* The "Thinking" section exhibits periods of lower importance scores in the middle, with higher scores at the beginning and end.
* The mean score and ratio provide a quantitative measure of the average importance score during the "Thinking" process.
### Interpretation
The chart suggests that the initial question has varying levels of importance associated with it. During the "Thinking" process, the importance score tends to decrease in the middle steps, potentially indicating a period of routine processing or less critical reasoning. The spikes at the beginning and end of the "Thinking" section may represent key insights or critical steps in the reasoning process. The mean score and ratio provide a baseline for evaluating the overall importance of the reasoning steps. The data demonstrates the dynamic nature of importance scores during both the question phase and the subsequent reasoning process.