## Heatmap/Bar Chart: Importance Score Across Reasoning Steps
### Overview
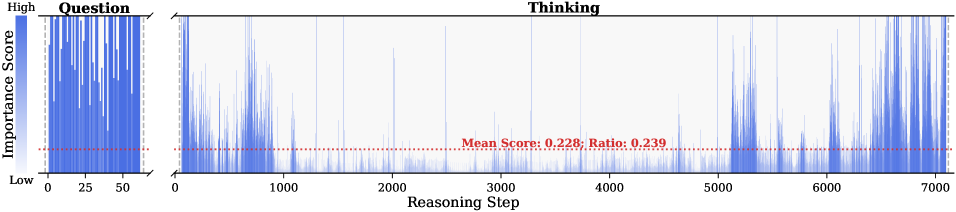
The image displays a two-part horizontal bar chart (or heatmap) visualizing "Importance Score" across a sequence of "Reasoning Steps." The chart is divided into two distinct sections labeled "Question" and "Thinking," suggesting an analysis of a model's or system's attention or focus during different phases of a task. The overall aesthetic is technical and data-dense, using a blue color gradient to represent score intensity.
### Components/Axes
* **Y-Axis (Vertical):** Labeled **"Importance Score"**. The scale is qualitative, marked with **"High"** at the top and **"Low"** at the bottom. There are no numerical tick marks on this axis.
* **X-Axis (Horizontal):** Labeled **"Reasoning Step"**. It is a numerical scale with major tick marks at intervals of 1000, ranging from **0** to **7000**.
* **Chart Sections:**
1. **Left Section ("Question"):** A separate, narrower panel on the far left. Its own x-axis ranges from **0** to **50**.
2. **Right Section ("Thinking"):** The main, wider panel. Its x-axis ranges from **0** to **7000**.
* **Data Representation:** Vertical blue bars (or lines) of varying height and density. The height of each bar corresponds to the "Importance Score" at that specific "Reasoning Step." The color intensity (shade of blue) appears correlated with height/score.
* **Annotation:** A horizontal **red dashed line** runs across the entire width of the "Thinking" section, positioned near the bottom of the y-axis scale. It is accompanied by red text: **"Mean Score: 0.228; Ratio: 0.239"**.
### Detailed Analysis
* **"Question" Section (Steps 0-50):**
* **Trend:** The bars are extremely dense and consistently tall, reaching near the "High" mark on the y-axis throughout the entire range.
* **Data Points:** This indicates that nearly every step within the initial "Question" phase (first 50 steps) is assigned a very high importance score. There is minimal variation; the importance is uniformly high.
* **"Thinking" Section (Steps 0-7000):**
* **Trend:** The distribution is highly non-uniform and sparse compared to the "Question" section. Importance scores are generally low, with sporadic, sharp peaks of high importance.
* **Data Points & Spatial Grounding:**
* **Steps 0-1000:** Contains several clusters of high-importance peaks, particularly dense between steps ~200-800.
* **Steps 1000-5000:** Shows a long period of predominantly low importance scores, with only a few isolated, narrow peaks (e.g., around steps ~1500, ~2500, ~3500).
* **Steps 5000-7000:** Experiences a significant resurgence in activity. There is a dense cluster of high-importance peaks starting around step 5200 and continuing, with varying density, through to step 7000.
* **Red Annotation Line:** The red dashed line is positioned at a constant y-value corresponding to the **"Mean Score: 0.228"**. Visually, this line sits very low on the "Importance Score" axis, confirming that the average importance across all 7000 "Thinking" steps is low. The **"Ratio: 0.239"** likely represents the proportion of steps considered "important" (perhaps those above a certain threshold).
### Key Observations
1. **Phase Dichotomy:** There is a stark contrast between the "Question" phase (uniformly high importance) and the "Thinking" phase (sporadic, peak-driven importance).
2. **Temporal Clustering in "Thinking":** High-importance reasoning steps are not randomly distributed. They occur in distinct temporal clusters: early in the process (0-1000), very sparsely in the middle (1000-5000), and heavily towards the end (5000-7000).
3. **Low Mean Importance:** Despite the visible peaks, the calculated mean score of 0.228 (on a normalized scale where "High" is presumably 1.0) indicates that the vast majority of "Thinking" steps have very low assigned importance.
4. **Density vs. Sparsity:** The "Question" section is information-dense (every step matters), while the "Thinking" section is information-sparse (most steps matter little, a few matter a lot).
### Interpretation
This chart likely visualizes the internal attention or salience map of a large language model or reasoning system as it processes a query.
* **What it suggests:** The system dedicates intense, uniform focus to understanding the initial **"Question"** (first 50 steps). The subsequent **"Thinking"** process (7000 steps) is not a steady, uniform effort. Instead, it involves long periods of low-importance processing (possibly background computation, hypothesis generation, or dead ends) punctuated by brief, critical moments of high-importance reasoning or decision-making (the peaks). The clustering of peaks at the end suggests a final synthesis or conclusion phase where many important steps occur in rapid succession.
* **How elements relate:** The "Question" phase sets the stage, consuming a small but uniformly critical portion of the process. The "Thinking" phase is the main computational effort, characterized by efficiency—most steps are low-cost (low importance), allowing resources to concentrate on the key reasoning leaps (the peaks). The mean score and ratio quantify this efficiency, showing that only about 24% of the thinking steps carry significant weight.
* **Notable anomalies/patterns:** The most striking pattern is the **long quiet period between steps 1000 and 5000**. This could represent a phase of exploration, verification, or waiting for sub-processes, where no single step is deemed critically important. The resurgence at the end is a common pattern in complex problem-solving, where disparate threads of thought converge. The chart effectively argues that "thinking" is not a smooth process but a punctuated equilibrium of insight.