## Bar Chart: GPT-4 Accuracy by Presentation Style
### Overview
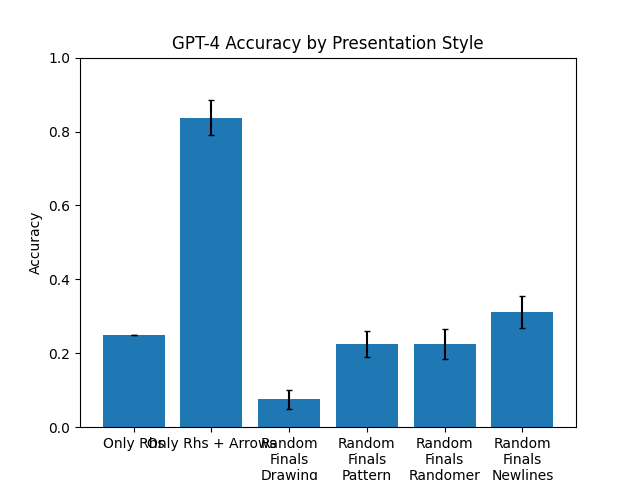
This is a vertical bar chart titled "GPT-4 Accuracy by Presentation Style." It compares the accuracy of the GPT-4 model across six different presentation styles or conditions. The chart includes error bars for each data point, indicating variability or confidence intervals. The overall visual trend shows one condition ("Only Rhs + Arrow") performing significantly better than all others.
### Components/Axes
* **Title:** "GPT-4 Accuracy by Presentation Style" (centered at the top).
* **Y-Axis:**
* **Label:** "Accuracy" (rotated vertically on the left side).
* **Scale:** Linear scale from 0.0 to 1.0, with major tick marks at 0.0, 0.2, 0.4, 0.6, 0.8, and 1.0.
* **X-Axis:**
* **Categories (from left to right):**
1. "Only Rhs"
2. "Only Rhs + Arrow"
3. "Random Finals Drawing"
4. "Random Finals Pattern"
5. "Random Finals Randomer"
6. "Random Finals Newlines"
* **Data Series:** A single series represented by blue bars. Each bar has a black error bar (whisker) extending above and below the top of the bar.
* **Legend:** No separate legend is present; the categories are labeled directly on the x-axis.
### Detailed Analysis
The following table reconstructs the approximate data from the chart. Values are estimated based on the bar heights relative to the y-axis grid.
| Presentation Style | Approximate Accuracy | Error Bar Range (Visual Estimate) | Trend Description |
| :--- | :--- | :--- | :--- |
| **Only Rhs** | ~0.25 | Very small range, approximately ±0.01 | A short bar, indicating low accuracy. |
| **Only Rhs + Arrow** | ~0.83 | Moderate range, approximately ±0.05 (from ~0.78 to ~0.88) | The tallest bar by a large margin, showing high accuracy. |
| **Random Finals Drawing** | ~0.08 | Moderate range, approximately ±0.03 (from ~0.05 to ~0.11) | The shortest bar, indicating the lowest accuracy. |
| **Random Finals Pattern** | ~0.22 | Moderate range, approximately ±0.04 (from ~0.18 to ~0.26) | Similar in height to "Only Rhs" and "Random Finals Randomer". |
| **Random Finals Randomer** | ~0.22 | Moderate range, approximately ±0.04 (from ~0.18 to ~0.26) | Nearly identical in height and error to "Random Finals Pattern". |
| **Random Finals Newlines** | ~0.31 | Moderate range, approximately ±0.05 (from ~0.26 to ~0.36) | Slightly taller than the previous two "Random Finals" variants. |
### Key Observations
1. **Dominant Performance:** The "Only Rhs + Arrow" condition is a clear outlier, achieving an accuracy (~0.83) more than three times higher than the next best condition.
2. **Low Baseline:** The "Only Rhs" condition (without an arrow) has a low accuracy (~0.25), suggesting the arrow is a critical component for the high performance in the second condition.
3. **Poor Performance of Randomization:** All conditions labeled "Random Finals..." perform poorly, with accuracies between ~0.08 and ~0.31. The "Drawing" variant is particularly ineffective.
4. **Clustering of Results:** The accuracies for "Only Rhs," "Random Finals Pattern," and "Random Finals Randomer" are all clustered in a similar low range (~0.22-0.25).
5. **Error Bars:** The error bars are relatively small for the lowest-performing condition ("Random Finals Drawing") and largest for the highest-performing one ("Only Rhs + Arrow"), which may indicate greater variance in results when accuracy is high.
### Interpretation
The data strongly suggests that the **presentation style has a dramatic impact on GPT-4's accuracy** for the given task. The key finding is the synergistic effect of combining "Only Rhs" with an "Arrow." This specific visual or structural cue appears to be a highly effective scaffold for the model, leading to a massive performance boost.
Conversely, introducing randomness into the "Finals" (likely meaning the final part of a prompt or output) through various methods ("Drawing," "Pattern," "Randomer," "Newlines") consistently degrades performance compared to the structured "Only Rhs + Arrow" condition. This implies that predictability and clear visual guidance are more beneficial than varied or unstructured presentations for this particular evaluation.
The chart demonstrates that minor changes in prompt or output formatting (like adding an arrow) can lead to order-of-magnitude differences in model performance, highlighting the importance of prompt engineering and the sensitivity of large language models to input structure.