## Data Tables: Share Price Index & Dividend Index
### Overview
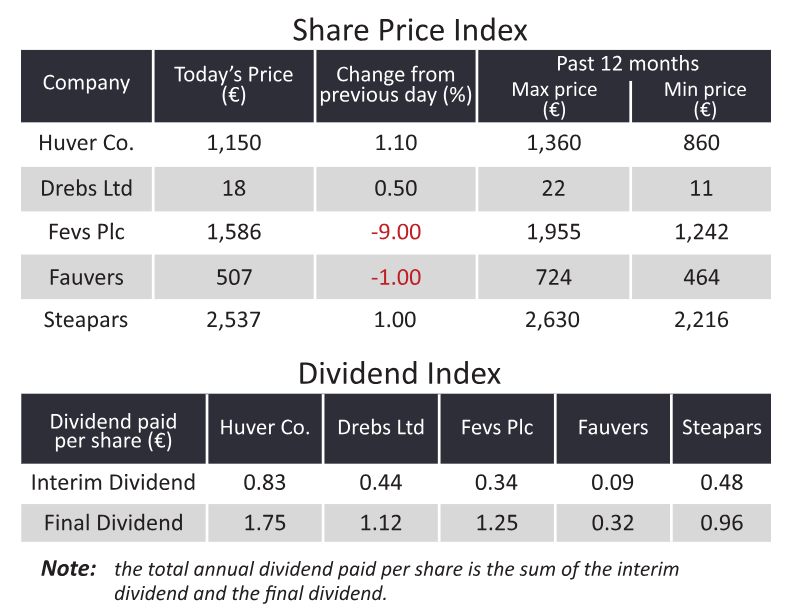
The image displays two distinct data tables presented in a clean, professional format. The top table is titled "Share Price Index" and provides stock market data for five companies. The bottom table is titled "Dividend Index" and details the dividend payments per share for the same five companies. A note at the bottom clarifies the calculation for total annual dividends.
### Components/Axes
**Table 1: Share Price Index**
* **Structure:** A 6-column, 6-row table (including header).
* **Column Headers (Left to Right):**
1. Company
2. Today's Price (€)
3. Change from previous day (%)
4. Past 12 months (This is a merged header spanning two sub-columns)
* Sub-column 1: Max price (€)
* Sub-column 2: Min price (€)
* **Row Headers (Top to Bottom):** The five companies listed are Huver Co., Drebs Ltd, Fevs Plc, Fauvers, and Steapars.
* **Visual Styling:** The header row has a dark background with white text. Data rows alternate between light grey and white backgrounds for readability. Negative percentage changes are displayed in red text.
**Table 2: Dividend Index**
* **Structure:** A 6-column, 3-row table (including header).
* **Column Headers (Left to Right):**
1. Dividend paid per share (€)
2. Huver Co.
3. Drebs Ltd
4. Fevs Plc
5. Fauvers
6. Steapars
* **Row Headers (Top to Bottom):**
1. Interim Dividend
2. Final Dividend
* **Visual Styling:** Similar to the first table, with a dark header row and alternating row backgrounds.
**Note Section:**
* Located below the Dividend Index table.
* Text: "Note: the total annual dividend paid per share is the sum of the interim dividend and the final dividend."
### Detailed Analysis
**Share Price Index Data:**
| Company | Today's Price (€) | Change from previous day (%) | Past 12 months Max price (€) | Past 12 months Min price (€) |
| :--------- | :---------------- | :--------------------------- | :---------------------------- | :--------------------------- |
| Huver Co. | 1,150 | 1.10 | 1,360 | 860 |
| Drebs Ltd | 18 | 0.50 | 22 | 11 |
| Fevs Plc | 1,586 | **-9.00** (in red) | 1,955 | 1,242 |
| Fauvers | 507 | **-1.00** (in red) | 724 | 464 |
| Steapars | 2,537 | 1.00 | 2,630 | 2,216 |
**Dividend Index Data:**
| Dividend Type | Huver Co. | Drebs Ltd | Fevs Plc | Fauvers | Steapars |
| :-------------- | :-------- | :-------- | :------- | :------ | :------- |
| Interim Dividend | 0.83 | 0.44 | 0.34 | 0.09 | 0.48 |
| Final Dividend | 1.75 | 1.12 | 1.25 | 0.32 | 0.96 |
**Calculated Total Annual Dividend (Interim + Final):**
* Huver Co.: €2.58
* Drebs Ltd: €1.56
* Fevs Plc: €1.59
* Fauvers: €0.41
* Steapars: €1.44
### Key Observations
1. **Price Volatility:** Fevs Plc shows the most significant single-day movement with a **-9.00%** drop. Fauvers also declined (-1.00%). The other three companies saw positive changes.
2. **Price Range:** Steapars has the highest share price (€2,537) and the narrowest 12-month trading range relative to its price (€2,216 to €2,630). Drebs Ltd has the lowest share price (€18).
3. **Dividend Disparity:** There is a wide range in dividend payments. Huver Co. pays the highest total annual dividend (€2.58), while Fauvers pays the lowest (€0.41).
4. **Dividend Structure:** For all companies, the Final Dividend is significantly larger than the Interim Dividend, typically by a factor of 2 to 3.5.
### Interpretation
This data provides a snapshot of financial performance and shareholder returns for five companies. The **Share Price Index** suggests mixed market sentiment on the day captured, with Fevs Plc experiencing a notable downturn. The 12-month high/low prices indicate Steapars has been the most stable in terms of price appreciation, trading near its annual high.
The **Dividend Index** reveals the companies' policies on returning cash to shareholders. The note is crucial for interpretation, confirming that the total annual payout is the simple sum of the two listed dividends. An investor analyzing this data would likely correlate the two tables. For instance:
* **Huver Co.** combines a solid share price with the highest dividend yield, potentially indicating a mature, income-focused company.
* **Fauvers** has both a declining share price and the lowest dividend, which could signal financial pressure or a growth phase where profits are reinvested.
* **Steapars** has the highest share price but a moderate dividend, which might reflect investor expectations for future growth over immediate income.
The data does not provide context for the observed changes (e.g., earnings reports, market conditions) or the companies' sectors, which would be necessary for a full investment analysis. The tables are purely quantitative, presenting facts without causal explanation.