\n
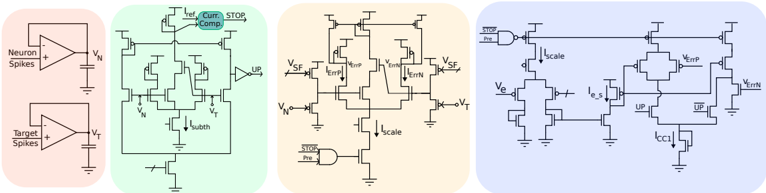
## Electronic Circuit Diagrams: Neuromorphic Computing Blocks
### Overview
The image presents four electronic circuit diagrams, likely representing building blocks for a neuromorphic computing system. The diagrams appear to illustrate different stages or components involved in processing neuron and target spike signals. The diagrams are arranged horizontally, suggesting a sequential flow of information or processing. Each diagram is contained within a colored rectangular border (red, green, yellow, and blue).
### Components/Axes
The diagrams do not have traditional axes or legends. Instead, they consist of interconnected transistors, operational amplifiers (op-amps), and logic gates. Key labels within the diagrams include:
* **V<sub>N</sub>**: Neuron Spikes (appears in the red diagram)
* **V<sub>T</sub>**: Target Spikes (appears in the red diagram)
* **I<sub>subth</sub>**: Subthreshold Current (appears in the green diagram)
* **Comp**: Comparator (appears in the green diagram)
* **UP**: Operational Amplifier (appears in the green, yellow, and blue diagrams)
* **V<sub>SF</sub>**: Signal Feedback (appears in the yellow diagram)
* **V<sub>ERN</sub>**: Error Neuron (appears in the yellow diagram)
* **V<sub>SE</sub>**: Signal Error (appears in the yellow diagram)
* **Scale**: Scaling factor (appears in the yellow and blue diagrams)
* **STOP**: Stop signal (appears in the yellow diagram)
* **V<sub>E</sub>**: Error Voltage (appears in the blue diagram)
* **I<sub>eS</sub>**: Error Signal Current (appears in the blue diagram)
* **V<sub>ENP</sub>**: Error Neuron Potential (appears in the blue diagram)
* **V<sub>rTN</sub>**: Reset Threshold Neuron (appears in the blue diagram)
* **I<sub>CCI</sub>**: Current Control Input (appears in the blue diagram)
### Detailed Analysis / Content Details
**Diagram 1 (Red):**
This diagram shows two op-amps connected to inputs labeled "Neuron Spikes" (V<sub>N</sub>) and "Target Spikes" (V<sub>T</sub>). Both inputs are connected to ground. This appears to be a differential amplifier configuration.
**Diagram 2 (Green):**
This diagram features a more complex arrangement of transistors. A transistor labeled "I<sub>subth</sub>" is connected to a comparator labeled "Comp". Several transistors are arranged in a feedback loop, with an op-amp labeled "UP" providing amplification.
**Diagram 3 (Yellow):**
This diagram includes multiple transistors and op-amps. Signals labeled "V<sub>SF</sub>" (Signal Feedback) and "V<sub>SE</sub>" (Signal Error) are present. A logic gate labeled "STOP" is also visible, along with a "Scale" input. The diagram also shows "V<sub>ERN</sub>" (Error Neuron).
**Diagram 4 (Blue):**
This diagram is the most complex, with numerous transistors and op-amps. It includes signals labeled "V<sub>E</sub>" (Error Voltage), "I<sub>eS</sub>" (Error Signal Current), "V<sub>ENP</sub>" (Error Neuron Potential), and "V<sub>rTN</sub>" (Reset Threshold Neuron). A "Scale" input and "I<sub>CCI</sub>" (Current Control Input) are also present.
### Key Observations
* The diagrams progressively increase in complexity from left to right.
* The presence of op-amps ("UP") in multiple diagrams suggests amplification and signal processing are key functions.
* The inclusion of "STOP" and "Scale" signals indicates control mechanisms for the circuits.
* The labels related to "Error" (V<sub>ERN</sub>, V<sub>SE</sub>, V<sub>E</sub>, I<sub>eS</sub>, V<sub>ENP</sub>) suggest error correction or learning mechanisms.
* The diagrams are likely designed to mimic the behavior of biological neurons and synapses.
### Interpretation
These diagrams likely represent a series of circuits designed to implement a simplified model of neural computation. The first diagram (red) could be a basic comparator or difference amplifier. The subsequent diagrams (green, yellow, and blue) appear to build upon this foundation, adding features for subthreshold current control, signal feedback, error correction, and scaling. The increasing complexity suggests a hierarchical processing structure, where signals are refined and adjusted as they pass through each stage. The presence of error-related signals indicates a learning or adaptation mechanism, where the circuits can adjust their behavior based on the difference between the neuron's output and a target signal. The overall system is likely intended to perform tasks such as pattern recognition, classification, or control, mimicking the functionality of a biological neural network. The diagrams are not providing specific data points, but rather a schematic representation of a system. The diagrams are a blueprint for a neuromorphic system, and the relationships between the components suggest a flow of information and processing.