## Heatmap: Cross-Dataset Performance
### Overview
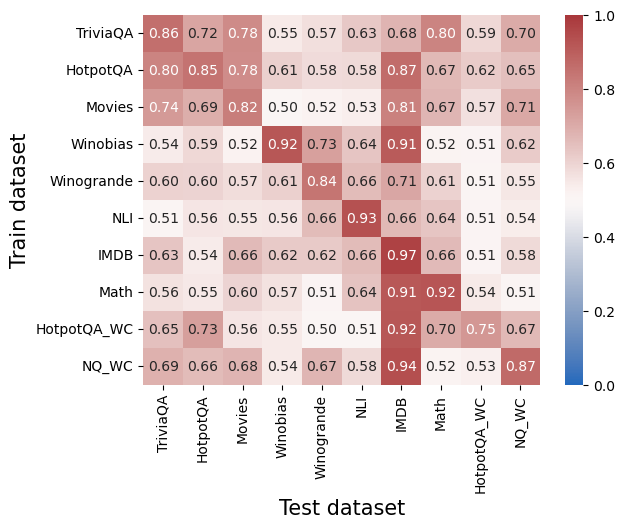
The image is a heatmap visualizing numerical performance scores (likely accuracy or a similar metric) for machine learning models. It compares models trained on one dataset (y-axis) and tested on another (x-axis). The values range from 0.0 to 1.0, with a color scale from blue (low) to red (high) indicating performance.
### Components/Axes
* **Y-axis (Vertical):** Labeled "Train dataset". Lists 10 datasets used for training:
1. TriviaQA
2. HotpotQA
3. Movies
4. Winobias
5. Winogrande
6. NLI
7. IMDB
8. Math
9. HotpotQA_WC
10. NQ_WC
* **X-axis (Horizontal):** Labeled "Test dataset". Lists the same 10 datasets used for testing, in the same order as the y-axis.
* **Color Scale/Legend:** Positioned on the right side of the chart. It is a vertical bar showing a gradient from blue (labeled `0.0`) at the bottom to red (labeled `1.0`) at the top. The midpoint (white/light color) is labeled `0.6`. This scale maps the numerical values in the grid to colors.
### Detailed Analysis
The heatmap is a 10x10 grid. Each cell contains a numerical value representing the performance score when the model trained on the row's dataset is tested on the column's dataset. The values are transcribed below in a table.
| Train \ Test | TriviaQA | HotpotQA | Movies | Winobias | Winogrande | NLI | IMDB | Math | HotpotQA_WC | NQ_WC |
|--------------|----------|----------|--------|----------|------------|-----|------|------|-------------|-------|
| **TriviaQA** | 0.86 | 0.72 | 0.78 | 0.55 | 0.57 | 0.63| 0.68 | 0.80 | 0.59 | 0.70 |
| **HotpotQA** | 0.80 | 0.85 | 0.78 | 0.61 | 0.58 | 0.58| 0.87 | 0.67 | 0.62 | 0.65 |
| **Movies** | 0.74 | 0.69 | 0.82 | 0.50 | 0.52 | 0.53| 0.81 | 0.67 | 0.57 | 0.71 |
| **Winobias** | 0.54 | 0.59 | 0.52 | 0.92 | 0.73 | 0.64| 0.91 | 0.52 | 0.51 | 0.62 |
| **Winogrande**| 0.60 | 0.60 | 0.57 | 0.61 | 0.84 | 0.66| 0.71 | 0.61 | 0.51 | 0.55 |
| **NLI** | 0.51 | 0.56 | 0.55 | 0.56 | 0.66 | 0.93| 0.66 | 0.64 | 0.51 | 0.54 |
| **IMDB** | 0.63 | 0.54 | 0.66 | 0.62 | 0.62 | 0.66| 0.97 | 0.66 | 0.51 | 0.58 |
| **Math** | 0.56 | 0.55 | 0.60 | 0.57 | 0.51 | 0.64| 0.91 | 0.92 | 0.54 | 0.51 |
| **HotpotQA_WC**| 0.65 | 0.73 | 0.56 | 0.55 | 0.50 | 0.51| 0.92 | 0.70 | 0.75 | 0.67 |
| **NQ_WC** | 0.69 | 0.66 | 0.68 | 0.54 | 0.67 | 0.58| 0.94 | 0.52 | 0.53 | 0.87 |
### Key Observations
1. **Diagonal Dominance:** The highest values in each row almost always occur on the main diagonal (where the Train and Test datasets are the same). This indicates models perform best when tested on the same dataset they were trained on. Examples: NLI→NLI (0.93), IMDB→IMDB (0.97), Math→Math (0.92).
2. **Strong Cross-Dataset Performance (IMDB Column):** The "Test IMDB" column shows consistently high scores (≥0.81) for models trained on many different datasets (TriviaQA, HotpotQA, Movies, Winobias, Winogrande, NLI, IMDB, Math, HotpotQA_WC, NQ_WC). This suggests the IMDB test set may be easier or that features learned from other datasets transfer well to it.
3. **Weak Cross-Dataset Performance:** Some train-test pairs show very low scores (<0.60), indicating poor transfer. For example, models trained on NLI, Math, or the "_WC" variants often score poorly on datasets like Winobias, Winogrande, HotpotQA_WC, and NQ_WC when not trained on them.
4. **"_WC" Dataset Behavior:** The "HotpotQA_WC" and "NQ_WC" datasets show moderate to high performance when tested on themselves (0.75 and 0.87 respectively) and on IMDB, but generally lower scores on other datasets. Their training rows also show lower scores on most other test sets.
### Interpretation
This heatmap is a transfer learning or generalization matrix for AI models across 10 distinct question-answering or text classification datasets. The data suggests:
* **Dataset Specificity:** Models are highly specialized. The strong diagonal indicates that knowledge learned from a specific dataset does not automatically generalize well to others, highlighting the challenge of creating broadly capable models.
* **Asymmetric Transfer:** Transfer is not symmetric. For instance, a model trained on Movies scores 0.81 on IMDB, but a model trained on IMDB scores only 0.66 on Movies. This implies the datasets have different underlying structures or difficulty levels.
* **The "Easy" Test Set:** The IMDB dataset appears to be a "universal" or easier target, as nearly all models perform well on it. This could be because it has distinctive features that are easily picked up by models trained on diverse data, or its evaluation metric is more lenient.
* **Cluster of Related Tasks:** The high diagonal and near-diagonal values for datasets like TriviaQA, HotpotQA, and Movies suggest these tasks share more commonalities with each other than with tasks like Winobias or NLI. The "_WC" datasets (likely "Wrong Context" variants) form another cluster with distinct behavior.
In essence, the chart maps the landscape of task relationships for these models. It visually answers: "If I train my model on task A, how well can I expect it to perform on task B?" The clear takeaway is that performance is highly dependent on the specific pair of tasks, with same-task performance being the most reliable.