## Scatter Plot: Accuracy vs. Time-to-Answer
### Overview
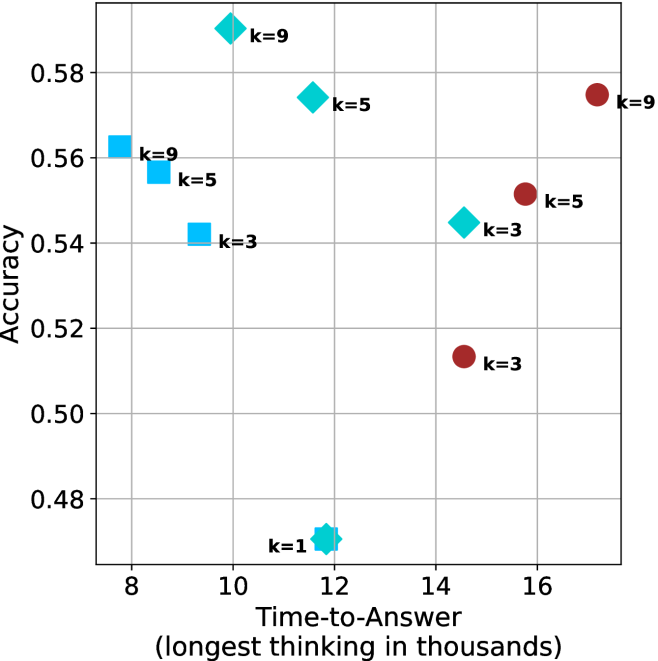
The image is a scatter plot showing the relationship between "Accuracy" and "Time-to-Answer" for different values of 'k'. The plot contains data points represented by two distinct shapes and colors: cyan squares, cyan diamonds, and brown circles, each labeled with a 'k' value (k=1, k=3, k=5, k=9). The x-axis represents "Time-to-Answer" in thousands, and the y-axis represents "Accuracy".
### Components/Axes
* **X-axis:** "Time-to-Answer (longest thinking in thousands)". The scale ranges from 8 to 16, with gridlines at each integer value.
* **Y-axis:** "Accuracy". The scale ranges from 0.48 to 0.58, with gridlines at intervals of 0.02.
* **Data Points:**
* Cyan Squares: k=9, k=5, k=3
* Cyan Diamonds: k=9, k=5, k=3, k=1
* Brown Circles: k=9, k=5, k=3
* **Labels:** Each data point is labeled with its corresponding 'k' value.
### Detailed Analysis
**Cyan Squares:**
* k=9: Accuracy ~0.56, Time-to-Answer ~8
* k=5: Accuracy ~0.56, Time-to-Answer ~9
* k=3: Accuracy ~0.54, Time-to-Answer ~9.5
**Cyan Diamonds:**
* k=9: Accuracy ~0.58, Time-to-Answer ~11
* k=5: Accuracy ~0.57, Time-to-Answer ~12
* k=3: Accuracy ~0.545, Time-to-Answer ~14
* k=1: Accuracy ~0.47, Time-to-Answer ~12
**Brown Circles:**
* k=9: Accuracy ~0.575, Time-to-Answer ~16.5
* k=5: Accuracy ~0.55, Time-to-Answer ~15
* k=3: Accuracy ~0.51, Time-to-Answer ~14.5
### Key Observations
* For cyan squares, as 'k' decreases, both accuracy and time-to-answer decrease.
* For cyan diamonds, as 'k' decreases from 9 to 3, the time-to-answer increases, while the accuracy decreases slightly. The k=1 diamond has the lowest accuracy and a time-to-answer similar to k=5.
* For brown circles, as 'k' decreases, both accuracy and time-to-answer decrease.
* The cyan squares have the lowest time-to-answer values.
* The brown circles have the highest time-to-answer values.
* The cyan diamonds have time-to-answer values between the cyan squares and brown circles.
### Interpretation
The scatter plot visualizes the trade-off between accuracy and time-to-answer for different values of 'k'. The data suggests that increasing 'k' generally leads to higher accuracy but also requires more time to answer. However, there are diminishing returns, as seen with the cyan diamonds, where increasing 'k' beyond a certain point does not significantly improve accuracy and may even decrease it (k=1). The different shapes (squares, diamonds, circles) likely represent different algorithms or methods being tested. The cyan squares appear to be the fastest but least accurate, while the brown circles are the slowest but more accurate. The cyan diamonds offer a balance between speed and accuracy, with k=9 performing the best among them. The outlier k=1 diamond suggests that a very low 'k' value can significantly degrade performance.