## Scatter Plot: Accuracy vs. Time-to-Answer
### Overview
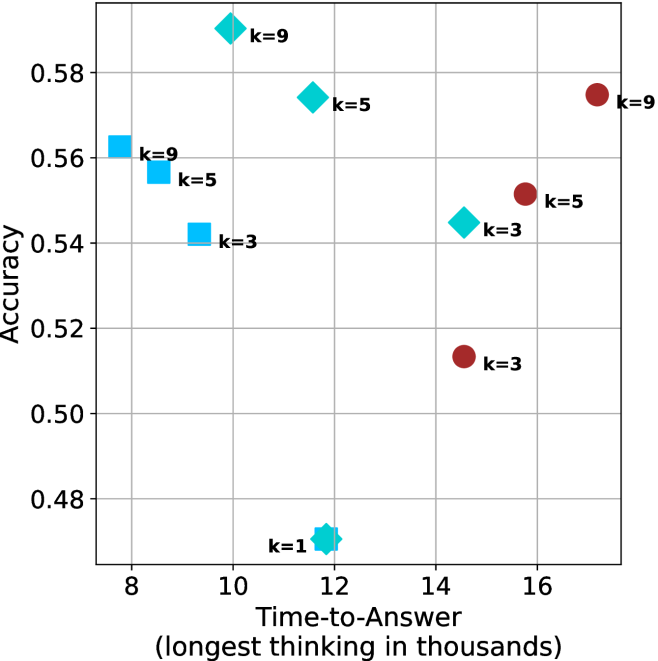
This image is a scatter plot visualizing the performance of different model configurations, categorized by 'k' values (likely representing a hyperparameter such as beam width, number of candidates, or shots). The plot maps "Accuracy" (y-axis) against "Time-to-Answer" (x-axis). The data points are differentiated by shape and color, suggesting distinct model families or methods.
### Components/Axes
* **Y-Axis:** Labeled "Accuracy". The scale ranges from 0.48 to 0.58, with grid lines at 0.02 intervals.
* **X-Axis:** Labeled "Time-to-Answer (longest thinking in thousands)". The scale ranges from 8 to 16, with grid lines at 2-unit intervals.
* **Data Series (Legend implied by shape/color):**
* **Cyan Squares:** Located in the left-center region.
* **Cyan Diamonds:** Located in the upper-left to center region.
* **Maroon Circles:** Located in the right-center region.
* **Cyan Star/Asterisk:** Located in the bottom-center region.
* **Annotations:** Each data point is labeled with its corresponding 'k' value (k=1, k=3, k=5, k=9).
### Detailed Analysis
The data points are clustered into three distinct groups based on color and shape. Below are the approximate coordinates (x, y) for each point:
**1. Cyan Squares (Left Cluster)**
* *Trend:* As time increases (moving right), accuracy decreases.
* k=9: (x ≈ 7.8, y ≈ 0.563)
* k=5: (x ≈ 8.5, y ≈ 0.557)
* k=3: (x ≈ 9.3, y ≈ 0.542)
**2. Cyan Diamonds (Upper-Left to Center Cluster)**
* *Trend:* As time increases (moving right), accuracy decreases.
* k=9: (x ≈ 9.8, y ≈ 0.591) — *Highest accuracy point on the chart.*
* k=5: (x ≈ 11.5, y ≈ 0.575)
* k=3: (x ≈ 14.5, y ≈ 0.545)
**3. Maroon Circles (Right Cluster)**
* *Trend:* As time increases (moving right), accuracy increases.
* k=9: (x ≈ 17.2, y ≈ 0.575)
* k=5: (x ≈ 15.8, y ≈ 0.552)
* k=3: (x ≈ 14.5, y ≈ 0.513)
**4. Outlier**
* Cyan Star (k=1): (x ≈ 11.8, y ≈ 0.472) — *Lowest accuracy point on the chart.*
### Key Observations
* **Performance Ceiling:** The Cyan Diamond (k=9) achieves the highest accuracy (≈ 0.59) while maintaining a relatively low "Time-to-Answer" (≈ 9.8).
* **Divergent Trends:** The Maroon Circles exhibit a positive correlation between time and accuracy (more time = more accuracy), whereas the Cyan Squares and Diamonds exhibit a negative correlation (more time = less accuracy).
* **Efficiency Gap:** The Cyan Diamonds consistently outperform the Cyan Squares at comparable 'k' levels, suggesting the Diamond configuration is more efficient.
* **The k=1 Anomaly:** The k=1 configuration (Cyan Star) is a significant outlier, performing poorly in accuracy despite a moderate time cost.
### Interpretation
This chart likely compares different inference strategies or model architectures.
* **The "Cyan" groups** appear to represent a model or method where increasing the 'k' parameter (e.g., beam search width) yields diminishing returns or even negative impacts on accuracy as the computational time increases. The "Diamond" variant of this method is clearly superior to the "Square" variant.
* **The "Maroon" group** represents a different method or model that scales differently. It requires significantly more time to achieve high accuracy (k=9), but it follows a standard "more compute = better results" trajectory.
* **Strategic Insight:** If the goal is to maximize accuracy while minimizing time, the Cyan Diamond configuration at k=9 is the optimal choice. The Maroon group is only competitive at high 'k' values, and even then, it does not exceed the accuracy of the Cyan Diamond (k=9) while requiring nearly double the "Time-to-Answer" (17.2 vs 9.8).