## Diagram: Network of Sets
### Overview
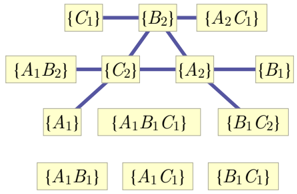
The image presents a diagram illustrating a network of sets, where each set is represented by a rectangular node containing its elements. The connections between the nodes indicate relationships or intersections between the sets.
### Components/Axes
* **Nodes:** Rectangular boxes containing set notations.
* **Edges:** Lines connecting the nodes, indicating relationships between the sets.
* **Set Labels:** The text within each node represents the elements of the set.
### Detailed Analysis
The diagram consists of several nodes, each representing a set. The sets are labeled with combinations of A, B, and C, along with numerical subscripts. The connections between the nodes are represented by lines.
* **Top Row:**
* Node 1 (top-left): `{C1}`
* Node 2 (top-center): `{B2}`
* Node 3 (top-right): `{A2 C1}`
* The node `{B2}` is connected to both `{C1}` and `{A2 C1}`.
* **Middle Row:**
* Node 4 (middle-left): `{A1 B2}`
* Node 5 (middle-center): `{C2}`
* Node 6 (middle-right): `{A2}`
* Node 7 (far middle-right): `{B1}`
* The node `{C2}` is connected to `{A1 B2}` and `{A2}`.
* The node `{A2}` is connected to `{B1}`.
* The node `{B2}` is connected to `{C2}` and `{A2}`.
* **Bottom Row:**
* Node 8 (bottom-left): `{A1}`
* Node 9 (bottom-center): `{A1 B1 C1}`
* Node 10 (bottom-right): `{B1 C2}`
* The node `{C2}` is connected to `{A1}` and `{A1 B1 C1}`.
* The node `{A2}` is connected to `{B1 C2}`.
* **Lowest Row:**
* Node 11 (lowest-left): `{A1 B1}`
* Node 12 (lowest-center): `{A1 C1}`
* Node 13 (lowest-right): `{B1 C1}`
### Key Observations
* The diagram shows a network of interconnected sets.
* The connections between the sets suggest relationships or intersections.
* The sets are labeled with combinations of A, B, and C, along with numerical subscripts.
### Interpretation
The diagram visually represents the relationships between different sets. The connections between the nodes indicate that the sets share elements or have some form of intersection. The specific nature of these relationships would require further context or information about the meaning of A, B, C, and the numerical subscripts. The diagram could be used to illustrate set theory concepts, data relationships, or network structures. The lowest row of nodes are not connected to the main network, suggesting they are related but distinct.