## Line Chart: EGA vs. Environment Step for Different αₛ Values
### Overview
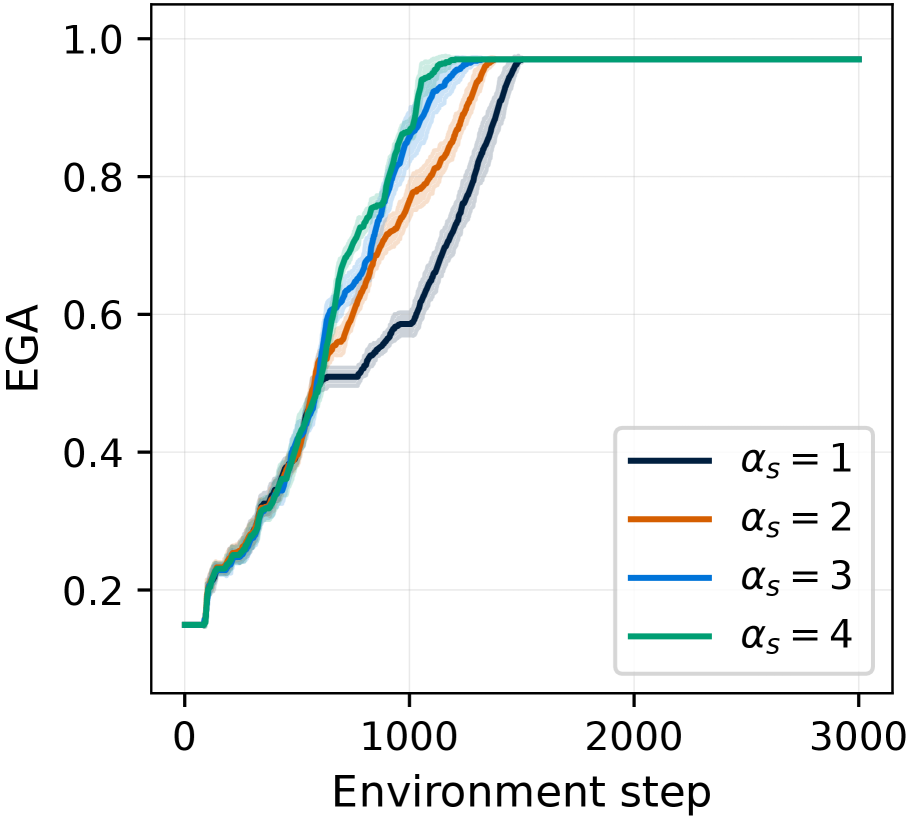
The image is a line chart plotting the performance metric "EGA" against "Environment step" for four different experimental conditions, labeled by the parameter αₛ. The chart shows learning curves where performance improves with more environment steps, eventually plateauing near a maximum value.
### Components/Axes
* **X-Axis (Horizontal):**
* **Label:** "Environment step"
* **Scale:** Linear, ranging from 0 to 3000.
* **Major Tick Marks:** 0, 1000, 2000, 3000.
* **Y-Axis (Vertical):**
* **Label:** "EGA"
* **Scale:** Linear, ranging from 0.0 to 1.0.
* **Major Tick Marks:** 0.0, 0.2, 0.4, 0.6, 0.8, 1.0.
* **Legend:**
* **Position:** Bottom-right corner of the plot area.
* **Content:** Four entries, each associating a colored line with a value of αₛ.
* Dark Blue Line: αₛ = 1
* Orange Line: αₛ = 2
* Blue Line: αₛ = 3
* Green Line: αₛ = 4
* **Data Series:** Four lines, each with a shaded region (likely representing confidence intervals or standard deviation) around the central trend line.
### Detailed Analysis
**Trend Verification & Data Points:**
All four lines follow a similar sigmoidal (S-shaped) learning curve: a slow start, a period of rapid increase, and a final plateau. The primary difference is the speed of learning.
1. **αₛ = 4 (Green Line):**
* **Trend:** This line shows the fastest initial learning. It rises most steeply from the start.
* **Key Points:** Begins at EGA ≈ 0.15 at step 0. Crosses EGA = 0.6 at approximately step 600. Reaches a near-plateau (EGA ≈ 0.95) by step ~1200. It is the first to converge.
2. **αₛ = 3 (Blue Line):**
* **Trend:** The second-fastest learning curve. It closely follows the green line initially but begins to lag slightly after step ~500.
* **Key Points:** Similar starting point (≈0.15). Crosses EGA = 0.6 at approximately step 700. Reaches the plateau (EGA ≈ 0.95) by step ~1400.
3. **αₛ = 2 (Orange Line):**
* **Trend:** Shows a moderate learning speed, clearly slower than αₛ=3 and 4.
* **Key Points:** Starts at ≈0.15. Crosses EGA = 0.6 at approximately step 800. Reaches the plateau (EGA ≈ 0.95) by step ~1600.
4. **αₛ = 1 (Dark Blue Line):**
* **Trend:** This is the slowest learning curve. It has the most gradual slope during the rapid learning phase.
* **Key Points:** Starts at ≈0.15. Crosses EGA = 0.6 at approximately step 1000. Reaches the plateau (EGA ≈ 0.95) by step ~1800.
**Convergence:** All four lines converge to the same final performance level, a plateau at an EGA value of approximately 0.95 to 0.97, by step 2000. From step 2000 to 3000, all lines are flat and overlapping at this maximum value.
### Key Observations
1. **Clear Performance Ordering:** There is a strict, monotonic relationship between the αₛ parameter and learning speed. Higher αₛ values (4 > 3 > 2 > 1) result in faster convergence to the maximum EGA.
2. **Identical Starting and Ending Points:** All conditions begin at the same low performance (EGA ≈ 0.15) and end at the same high performance (EGA ≈ 0.96). The parameter αₛ affects the *rate* of learning, not the initial state or final asymptotic performance.
3. **Convergence Point:** The lines begin to merge and become indistinguishable from each other starting around step 1500-1800, with full convergence by step 2000.
4. **Shaded Regions:** The shaded confidence bands are narrowest at the start and end of training and widest during the period of most rapid learning (between steps 500 and 1500), indicating higher variance in performance across runs during this phase.
### Interpretation
This chart demonstrates the effect of the hyperparameter αₛ on the sample efficiency of a learning algorithm (likely in reinforcement learning, given the "Environment step" axis). The data suggests that **increasing αₛ accelerates the learning process** without affecting the final achievable performance.
* **What it means:** A higher αₛ value allows the agent or model to extract more useful signal from each environment interaction, leading to faster skill acquisition. This could be due to αₛ controlling a learning rate, a target update frequency, or a similar mechanism that governs how aggressively the model updates its knowledge.
* **Why it matters:** In practical applications, sample efficiency is critical. Reducing the number of environment steps needed to reach peak performance (e.g., from 1800 steps with αₛ=1 to 1200 steps with αₛ=4) translates to significantly lower computational cost and faster development cycles.
* **Underlying Pattern:** The sigmoidal shape is characteristic of learning curves, where initial exploration is slow, followed by a phase of rapid insight and improvement, and finally a refinement phase as performance approaches its limit. The parameter αₛ effectively stretches or compresses this curve along the time (step) axis. The fact that all curves reach the same plateau indicates the task has a fixed maximum difficulty or performance ceiling that is achievable by all configurations, given enough time.