## Histogram: Distribution of Thinking Tokens
### Overview
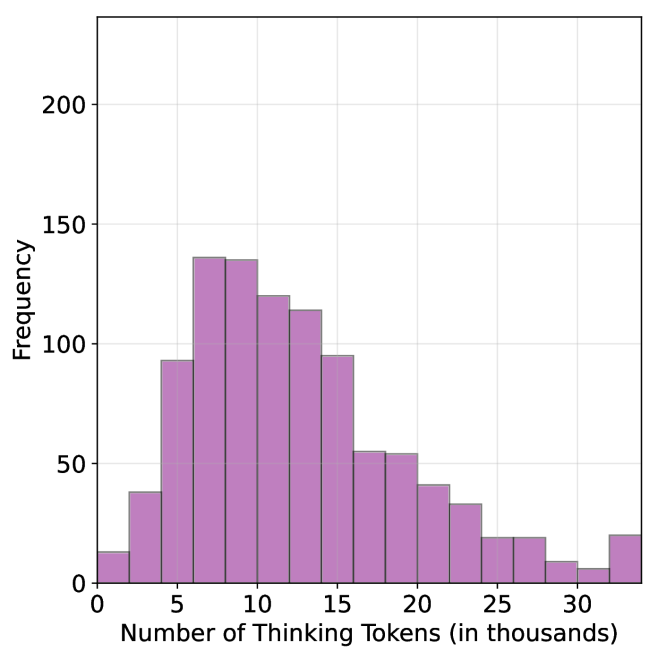
The image is a histogram showing the distribution of "Thinking Tokens" in thousands. The x-axis represents the number of thinking tokens, and the y-axis represents the frequency (count) of occurrences. The bars are light purple.
### Components/Axes
* **X-axis:** Number of Thinking Tokens (in thousands). The axis ranges from 0 to 30, with tick marks at intervals of 5 (0, 5, 10, 15, 20, 25, 30).
* **Y-axis:** Frequency. The axis ranges from 0 to 200, with tick marks at intervals of 50 (0, 50, 100, 150, 200).
* **Bars:** Light purple, representing the frequency of each range of thinking tokens.
### Detailed Analysis
Here's a breakdown of the approximate frequency for each range of thinking tokens:
* **0-2.5:** Approximately 12
* **2.5-5:** Approximately 38
* **5-7.5:** Approximately 92
* **7.5-10:** Approximately 135
* **10-12.5:** Approximately 120
* **12.5-15:** Approximately 112
* **15-17.5:** Approximately 90
* **17.5-20:** Approximately 55
* **20-22.5:** Approximately 42
* **22.5-25:** Approximately 32
* **25-27.5:** Approximately 18
* **27.5-30:** Approximately 10
* **30-32.5:** Approximately 22
### Key Observations
* The distribution is unimodal and skewed to the right.
* The highest frequency occurs between 7.5 and 10 thousand thinking tokens.
* The frequency decreases as the number of thinking tokens increases beyond 10 thousand, with a slight increase at the end.
### Interpretation
The histogram suggests that the most common number of "Thinking Tokens" is between 7,500 and 10,000. The right skew indicates that while most instances have a relatively low number of tokens, there are some instances with a significantly higher number of tokens, pulling the average to the right. The slight increase at the end (30-32.5) could indicate a secondary, smaller group with a high number of tokens. The data demonstrates the distribution of "Thinking Tokens" and highlights the typical range and the presence of outliers with higher token counts.