## Histogram: Distribution of Thinking Tokens
### Overview
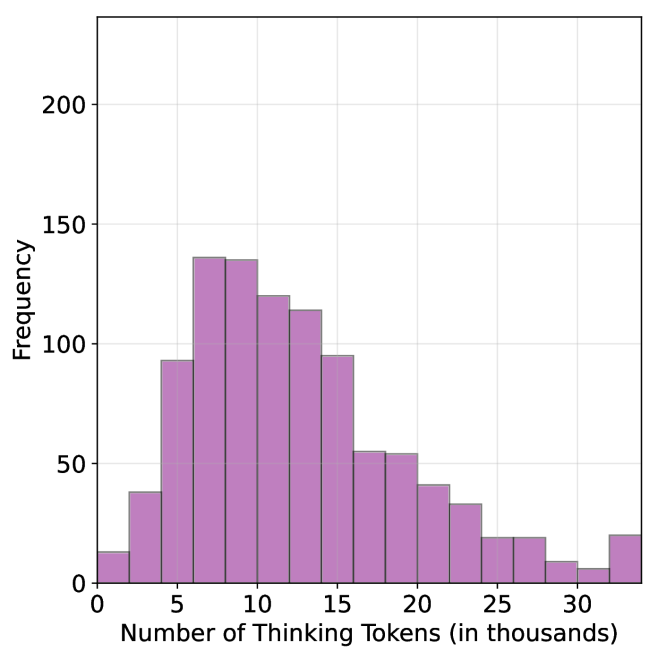
This image is a histogram displaying the frequency distribution of "Thinking Tokens" used in a specific process or model. The X-axis represents the quantity of tokens in thousands, while the Y-axis represents the frequency of occurrence. The distribution is right-skewed, indicating that while most tasks require a moderate number of tokens, there is a "long tail" of tasks requiring significantly higher token counts.
### Components/Axes
* **Chart Type:** Histogram with light purple bars and dark outlines.
* **X-Axis:** Labeled "Number of Thinking Tokens (in thousands)".
* Scale: Ranges from 0 to approximately 35.
* Major ticks: 0, 5, 10, 15, 20, 25, 30.
* Grid lines: Vertical grid lines align with the major ticks.
* **Y-Axis:** Labeled "Frequency".
* Scale: Ranges from 0 to slightly above 200.
* Major ticks: 0, 50, 100, 150, 200.
* Grid lines: Horizontal grid lines align with the major ticks.
### Detailed Analysis
The histogram consists of 17 distinct bins, each representing a range of approximately 2,000 tokens. Below are the estimated frequencies for each bin based on visual inspection:
| Token Range (in thousands) | Estimated Frequency |
| :--- | :--- |
| 0 – 2 | ~15 |
| 2 – 4 | ~40 |
| 4 – 6 | ~95 |
| 6 – 8 | ~135 |
| 8 – 10 | ~135 |
| 10 – 12 | ~120 |
| 12 – 14 | ~115 |
| 14 – 16 | ~95 |
| 16 – 18 | ~55 |
| 18 – 20 | ~55 |
| 20 – 22 | ~40 |
| 22 – 24 | ~35 |
| 24 – 26 | ~20 |
| 26 – 28 | ~20 |
| 28 – 30 | ~10 |
| 30 – 32 | ~8 |
| 32 – 34+ | ~20 |
*Note: Values are estimated based on the visual height of the bars relative to the Y-axis grid lines. Uncertainty is approximately ±5 units.*
### Key Observations
* **Primary Mode:** The distribution peaks between 6,000 and 10,000 tokens, where the frequency reaches its maximum of approximately 135 occurrences per bin.
* **Right Skew:** The data exhibits a clear right-skewed distribution, meaning the majority of the data points are concentrated on the lower end of the token spectrum, with a long tail extending toward higher token counts.
* **The "Tail" Anomaly:** There is a noticeable, albeit small, uptick in frequency in the final bin (32,000+ tokens). This deviates from the otherwise smooth decline of the tail, suggesting a potential "overflow" bin or a specific cluster of highly complex tasks that hit a maximum token limit.
### Interpretation
The data suggests that the vast majority of "thinking" tasks are completed within a range of 6,000 to 16,000 tokens. This indicates a standard operational efficiency or complexity level for the model or process being measured.
The "long tail" indicates that while rare, there are tasks that require significantly more computational "thought" (up to 30,000+ tokens). The small, unexpected rise in the final bin (32,000+ tokens) is particularly interesting; in technical contexts, this often represents a "ceiling" effect where tasks that would have required even more tokens are truncated or forced to conclude at that specific threshold. Alternatively, it could represent a specific class of "hard" problems that are consistently pushed to the maximum allowable token limit.