## Diagram: Image and Matrix Representation of Training and Test Instances
### Overview
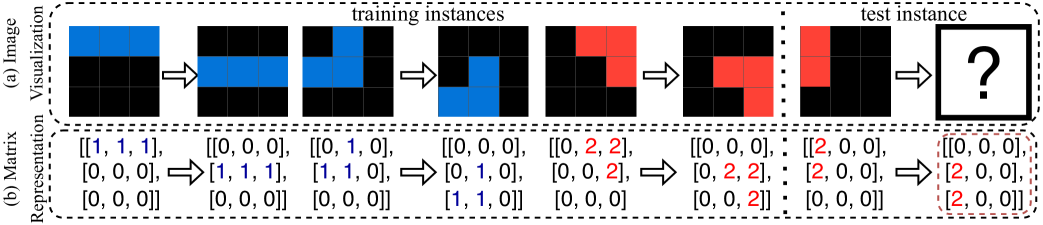
The image illustrates the transformation of image data into matrix representations for training and testing purposes. It shows a sequence of 3x3 pixel images, each represented by a corresponding 3x3 matrix. The images transition from blue pixels (represented by '1' in the matrix) to red pixels (represented by '2' in the matrix), demonstrating a pattern recognition process. The final step presents a test instance with a question mark, indicating a prediction task.
### Components/Axes
* **(a) Image Visualization:** This section displays the images as 3x3 grids of colored pixels.
* **(b) Matrix Representation:** This section shows the corresponding 3x3 matrices representing the pixel values.
* **Training Instances:** A sequence of images and matrices used for training a model.
* **Test Instance:** A final image and matrix for which a prediction is to be made.
* **Pixel Colors:** Blue pixels are represented by the number '1', red pixels are represented by the number '2', and black pixels are represented by the number '0'.
* **Arrows:** Arrows indicate the progression from one training instance to the next, and finally to the test instance.
### Detailed Analysis
The diagram is structured into two rows: the top row shows the image visualization, and the bottom row shows the corresponding matrix representation. The diagram progresses from left to right, showing a sequence of training instances followed by a test instance.
**Image Visualization (Top Row):**
1. **Instance 1:** A 3x3 grid with the top row filled with blue pixels. The rest of the pixels are black.
2. **Instance 2:** A 3x3 grid with the middle row filled with blue pixels. The rest of the pixels are black.
3. **Instance 3:** A 3x3 grid with an L-shape of blue pixels in the bottom-left corner. The rest of the pixels are black.
4. **Instance 4:** A 3x3 grid with an L-shape of blue pixels in the bottom-left corner. The rest of the pixels are black.
5. **Instance 5:** A 3x3 grid with an L-shape of red pixels in the top-right corner. The rest of the pixels are black.
6. **Instance 6:** A 3x3 grid with an L-shape of red pixels in the top-left corner. The rest of the pixels are black.
7. **Test Instance:** A 3x3 grid with a large question mark in the center, indicating an unknown pattern.
**Matrix Representation (Bottom Row):**
Each matrix corresponds to the image above it, with '1' representing blue pixels, '2' representing red pixels, and '0' representing black pixels.
1. **Instance 1:** `[[1, 1, 1], [0, 0, 0], [0, 0, 0]]`
2. **Instance 2:** `[[0, 0, 0], [1, 1, 1], [0, 0, 0]]`
3. **Instance 3:** `[[0, 1, 0], [1, 1, 0], [0, 0, 0]]`
4. **Instance 4:** `[[0, 0, 0], [0, 1, 0], [1, 1, 0]]`
5. **Instance 5:** `[[0, 2, 2], [0, 0, 2], [0, 0, 0]]`
6. **Instance 6:** `[[0, 0, 0], [2, 2, 2], [0, 0, 2]]`
7. **Test Instance:** `[[0, 0, 0], [2, 0, 0], [2, 0, 0]]`
### Key Observations
* The diagram demonstrates a transformation of visual data into numerical matrix representations.
* The training instances show a progression of patterns, initially blue and then red.
* The test instance requires the model to predict the pattern based on the training data.
* The matrix representation accurately reflects the pixel arrangement in the images.
### Interpretation
The diagram illustrates a simplified machine learning process where images are converted into numerical data (matrices) for training a model. The model learns patterns from the training instances and then uses this knowledge to predict the pattern in the test instance. The transition from blue to red pixels suggests a change in the feature being learned. The question mark in the test instance highlights the core task of machine learning: prediction based on learned patterns. The diagram is a visual representation of how computers can "see" and process images by converting them into numerical data.