## Chart Type: Line Graphs Comparing "I-Don't-Know" Rate
### Overview
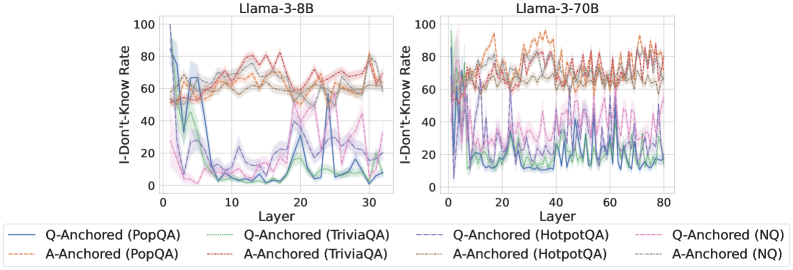
The image presents two line graphs side-by-side, comparing the "I-Don't-Know" rate across different layers of two language models: Llama-3-8B (left) and Llama-3-70B (right). Each graph plots the "I-Don't-Know" rate (y-axis) against the layer number (x-axis) for various question-answering datasets (PopQA, TriviaQA, HotpotQA, and NQ), with both question-anchored (Q-Anchored) and answer-anchored (A-Anchored) approaches. The shaded regions around each line represent the uncertainty or variance in the data.
### Components/Axes
* **Titles:**
* Left Graph: "Llama-3-8B"
* Right Graph: "Llama-3-70B"
* **Y-Axis:**
* Label: "I-Don't-Know Rate"
* Scale: 0 to 100, with tick marks at 0, 20, 40, 60, 80, and 100.
* **X-Axis:**
* Label: "Layer"
* Left Graph Scale: 0 to 30, with tick marks every 10 units.
* Right Graph Scale: 0 to 80, with tick marks every 20 units.
* **Legend:** Located at the bottom of the image, describing the lines:
* Blue solid line: "Q-Anchored (PopQA)"
* Brown dashed line: "A-Anchored (PopQA)"
* Green dotted line: "Q-Anchored (TriviaQA)"
* Brown dotted line: "A-Anchored (TriviaQA)"
* Red dashed line: "Q-Anchored (HotpotQA)"
* Brown dotted line: "A-Anchored (HotpotQA)"
* Purple dotted line: "Q-Anchored (NQ)"
* Brown dotted line: "A-Anchored (NQ)"
### Detailed Analysis
#### Llama-3-8B (Left Graph)
* **Q-Anchored (PopQA) (Blue solid line):** Starts at approximately 85-90% at layer 0, drops sharply to around 5-10% by layer 10, and then fluctuates between 5% and 30% for the remaining layers.
* **A-Anchored (PopQA) (Brown dashed line):** Starts at approximately 50% at layer 0, rises to around 60-70% and remains relatively stable with minor fluctuations.
* **Q-Anchored (TriviaQA) (Green dotted line):** Starts at approximately 60% at layer 0, drops to around 5-10% by layer 10, and then fluctuates between 5% and 20% for the remaining layers.
* **A-Anchored (TriviaQA) (Brown dotted line):** Starts at approximately 50% at layer 0, rises to around 60-70% and remains relatively stable with minor fluctuations.
* **Q-Anchored (HotpotQA) (Red dashed line):** Starts at approximately 60% at layer 0, rises to around 70-80% and remains relatively stable with minor fluctuations.
* **A-Anchored (HotpotQA) (Brown dotted line):** Starts at approximately 50% at layer 0, rises to around 60-70% and remains relatively stable with minor fluctuations.
* **Q-Anchored (NQ) (Purple dotted line):** Starts at approximately 60% at layer 0, drops to around 5-10% by layer 10, and then fluctuates between 5% and 20% for the remaining layers.
* **A-Anchored (NQ) (Brown dotted line):** Starts at approximately 50% at layer 0, rises to around 60-70% and remains relatively stable with minor fluctuations.
#### Llama-3-70B (Right Graph)
* **Q-Anchored (PopQA) (Blue solid line):** Starts at approximately 20% at layer 0, fluctuates between 10% and 40% for the remaining layers.
* **A-Anchored (PopQA) (Brown dashed line):** Starts at approximately 70% at layer 0, fluctuates between 60% and 90% for the remaining layers.
* **Q-Anchored (TriviaQA) (Green dotted line):** Starts at approximately 20% at layer 0, fluctuates between 10% and 30% for the remaining layers.
* **A-Anchored (TriviaQA) (Brown dotted line):** Starts at approximately 70% at layer 0, fluctuates between 60% and 80% for the remaining layers.
* **Q-Anchored (HotpotQA) (Red dashed line):** Starts at approximately 70% at layer 0, fluctuates between 60% and 90% for the remaining layers.
* **A-Anchored (HotpotQA) (Brown dotted line):** Starts at approximately 70% at layer 0, fluctuates between 60% and 80% for the remaining layers.
* **Q-Anchored (NQ) (Purple dotted line):** Starts at approximately 40% at layer 0, fluctuates between 20% and 50% for the remaining layers.
* **A-Anchored (NQ) (Brown dotted line):** Starts at approximately 70% at layer 0, fluctuates between 60% and 80% for the remaining layers.
### Key Observations
* For Llama-3-8B, the Q-Anchored approach for PopQA, TriviaQA, and NQ datasets shows a significant drop in the "I-Don't-Know" rate in the initial layers, while the A-Anchored approach remains relatively stable.
* For Llama-3-70B, the "I-Don't-Know" rates fluctuate more across layers for all datasets and anchoring methods compared to Llama-3-8B.
* The "I-Don't-Know" rate is generally higher for A-Anchored methods compared to Q-Anchored methods, especially for PopQA, TriviaQA, and NQ datasets in Llama-3-8B.
* HotpotQA consistently shows a higher "I-Don't-Know" rate compared to other datasets for both models and anchoring methods.
### Interpretation
The graphs illustrate how the "I-Don't-Know" rate varies across different layers of the Llama-3-8B and Llama-3-70B language models when answering questions from various datasets using question-anchored (Q-Anchored) and answer-anchored (A-Anchored) approaches.
The sharp drop in the "I-Don't-Know" rate for Q-Anchored methods in Llama-3-8B suggests that the model quickly learns to answer questions from PopQA, TriviaQA, and NQ datasets using the question as a starting point. The relatively stable "I-Don't-Know" rate for A-Anchored methods indicates that the model may find it more challenging to answer questions when starting from the answer.
The higher "I-Don't-Know" rates and greater fluctuations in Llama-3-70B suggest that this larger model may be more sensitive to the specific layer and anchoring method used. The consistently high "I-Don't-Know" rate for HotpotQA indicates that this dataset may contain more complex or ambiguous questions that the models struggle to answer.
The differences in "I-Don't-Know" rates between the two models and across datasets and anchoring methods highlight the importance of carefully selecting the appropriate model, dataset, and anchoring method for a given question-answering task. The data suggests that smaller models may be more efficient for certain tasks, while larger models may be necessary for more complex questions.