## Heatmap: Token Activation Across Neural Network Layers
### Overview
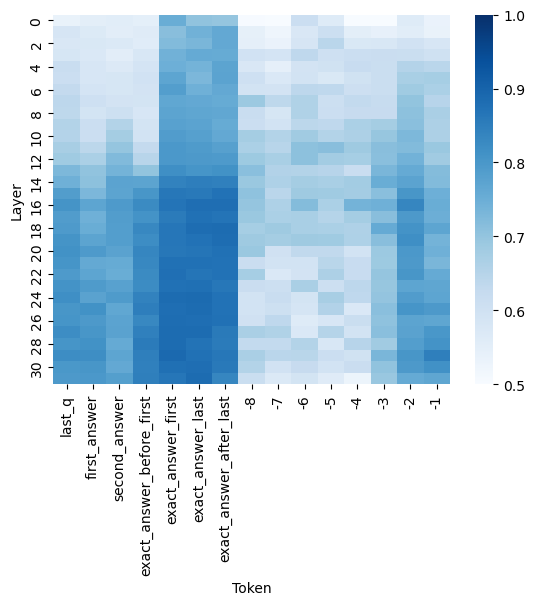
The image is a heatmap visualizing the intensity of a metric (likely attention weight, activation strength, or probability) for specific tokens across the layers of a neural network model. The heatmap uses a blue color gradient to represent values, with darker blue indicating higher values. The data suggests an analysis of how a model processes or attends to different parts of a question-answer sequence.
### Components/Axes
* **Y-Axis (Vertical):** Labeled "Layer". It represents the depth within the neural network, with layers numbered from 0 at the top to 30 at the bottom. The axis has tick marks at intervals of 2 (0, 2, 4, ..., 30).
* **X-Axis (Horizontal):** Labeled "Token". It lists specific tokens or positions in a text sequence. From left to right, the tokens are:
1. `last_q`
2. `first_answer`
3. `second_answer`
4. `exact_answer_before_first`
5. `exact_answer_first`
6. `exact_answer_last`
7. `exact_answer_after_last`
8. `-8`
9. `-7`
10. `-6`
11. `-5`
12. `-4`
13. `-3`
14. `-2`
15. `-1`
* **Color Bar (Legend):** Located on the right side of the chart. It provides a scale for interpreting the cell colors.
* **Label:** None explicit, but the scale implies a normalized value (e.g., attention score, probability).
* **Range:** 0.5 (lightest blue/white) to 1.0 (darkest blue).
* **Ticks:** Marked at 0.5, 0.6, 0.7, 0.8, 0.9, and 1.0.
### Detailed Analysis
The heatmap shows a 31 (Layers 0-30) by 15 (Tokens) grid of colored cells. The color intensity represents the value for each (Layer, Token) pair.
**Trend Verification & Spatial Grounding:**
* **Left Token Group (`last_q` to `exact_answer_after_last`):** This group generally shows higher values (darker blue) compared to the right group.
* `exact_answer_first` and `exact_answer_last` exhibit the highest and most consistent values across the middle to lower layers (approximately layers 8-28), appearing as a dark blue vertical band. Their values are estimated to be between 0.85 and 1.0 in this region.
* `exact_answer_before_first` and `exact_answer_after_last` also show high values, but slightly less intense and consistent than the central two.
* `last_q`, `first_answer`, and `second_answer` have more moderate and variable values. They show lighter blue (values ~0.6-0.75) in the top layers (0-10), becoming darker (values ~0.75-0.9) in the middle and lower layers.
* **Right Token Group (`-8` to `-1`):** This group, likely representing positional tokens or tokens preceding the answer, shows significantly lower values overall.
* The cells are predominantly light blue to white, indicating values between 0.5 and 0.7.
* There is a subtle pattern where tokens closer to `-1` (e.g., `-2`, `-1`) have slightly darker blue patches in some middle layers (e.g., around layers 14-22) compared to tokens like `-8` or `-7`, but the values remain low (estimated ≤0.75).
* **Layer-wise Trend:** For most tokens, values tend to be lower (lighter) in the very top layers (0-4) and increase (darken) in the middle layers (8-24), before sometimes slightly decreasing again in the final layers (26-30). This is most pronounced for the answer-related tokens.
### Key Observations
1. **Strong Focus on Exact Answer Tokens:** The model's highest activations are concentrated on the tokens `exact_answer_first` and `exact_answer_last`, particularly in the middle layers. This suggests these positions are critically important for the model's internal processing related to the task.
2. **Clear Differentiation Between Answer and Context:** There is a stark contrast in activation levels between the semantic answer tokens (left group) and the positional/preceding tokens (right group). The model clearly distinguishes their importance.
3. **Mid-Layer Processing Peak:** The core processing, as indicated by peak activation values, appears to occur in the network's middle layers (roughly 8-24), not at the very beginning or end.
4. **Gradual Information Flow:** The increasing activation from top layers to middle layers for answer tokens suggests information is being progressively integrated and refined as it moves through the network.
### Interpretation
This heatmap likely visualizes **attention weights** or **hidden state activations** from a transformer-based model (like BERT or GPT) during a question-answering task. The "Token" axis represents specific positions in the input sequence fed to the model.
* **What the data suggests:** The model pays the most "attention" or assigns the highest importance to the exact span of the answer (`exact_answer_first` to `exact_answer_last`). The tokens immediately before and after this span are also highly relevant, forming a context window around the answer. The question token (`last_q`) and other answer candidates (`first_answer`, `second_answer`) are moderately important. The model largely ignores the tokens far before the answer (represented by `-8` to `-4`).
* **How elements relate:** The layer-wise progression shows how information flows. Early layers may perform basic token embedding, middle layers perform complex reasoning and attention focusing on the answer span, and final layers may prepare the output. The clear separation between answer and non-answer tokens indicates the model has successfully learned to identify the critical part of the input for its task.
* **Notable Anomalies/Patterns:** The near-perfect vertical band of high activation for `exact_answer_first` and `exact_answer_last` is striking. It implies these two positions are almost always the focal point, regardless of layer depth after the initial few. This could be a signature of a model fine-tuned for extractive QA, where pinpointing the exact answer boundaries is the primary objective. The lower values for `-1` and `-2` compared to other negative tokens might indicate a slight "edge effect" where the model pays a tiny bit more attention to tokens immediately preceding the answer block.