## Line Charts: Comparative Performance of ERL and RLVR Across Environments
### Overview
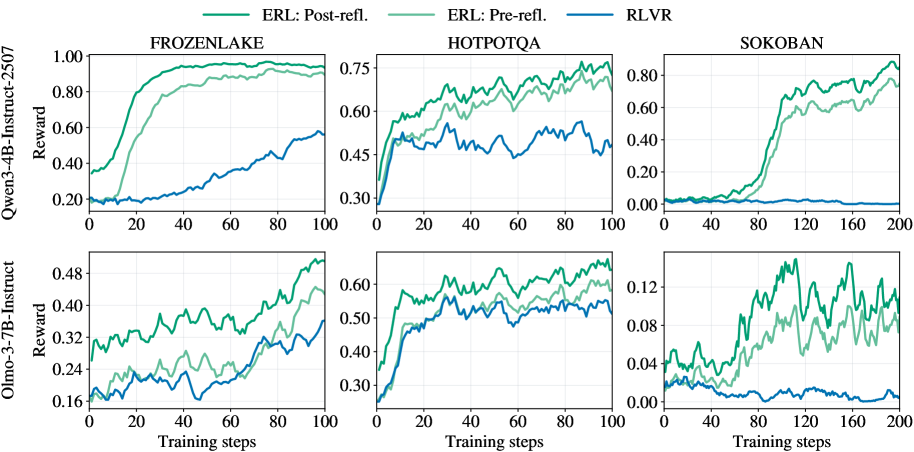
The image displays a set of six line charts arranged in a 2x3 grid. The charts compare the training performance (measured in "Reward") of three different reinforcement learning or training methods across three distinct environments. The comparison is conducted for two different base language models.
### Components/Axes
* **Grid Structure:** Two rows, three columns.
* **Row Labels (Y-axis titles for the entire row):**
* Top Row: `Qwen-3-4B-Instruct-2507` (Y-axis label: `Reward`)
* Bottom Row: `Olmo-3-7B-Instruct` (Y-axis label: `Reward`)
* **Column Labels (Chart Titles):**
* Left Column: `FROZENLAKE`
* Middle Column: `HOTPOTQA`
* Right Column: `SOKOBAN`
* **X-axis:** Labeled `Training steps` for all charts. The scale varies:
* FROZENLAKE and HOTPOTQA charts: 0 to 100 steps.
* SOKOBAN charts: 0 to 200 steps.
* **Y-axis:** Labeled `Reward` for all charts. The scale and range differ significantly per chart and model.
* **Legend:** Located at the top center of the entire figure. It defines three data series:
* `ERL: Post-refl.` (Dark Green line)
* `ERL: Pre-refl.` (Light Green line)
* `RLVR` (Blue line)
### Detailed Analysis
**1. Top Row: Qwen-3-4B-Instruct-2507 Model**
* **FROZENLAKE (Top-Left):**
* **Trend Verification:** Both ERL lines show a steep, sigmoidal increase, plateauing near the top. The RLVR line shows a slow, steady linear increase.
* **Data Points (Approximate):**
* `ERL: Post-refl.`: Starts ~0.35, rises sharply between steps 10-40, plateaus near 1.0 by step 60.
* `ERL: Pre-refl.`: Starts ~0.20, follows a similar but slightly delayed and lower trajectory than Post-refl., plateaus near 0.95.
* `RLVR`: Starts ~0.20, increases gradually to ~0.55 by step 100.
* **HOTPOTQA (Top-Middle):**
* **Trend Verification:** All three lines show an initial rapid rise followed by noisy, fluctuating plateaus. ERL lines consistently outperform RLVR.
* **Data Points (Approximate):**
* `ERL: Post-refl.`: Starts ~0.30, rises to ~0.70 by step 40, fluctuates between 0.65-0.75 thereafter.
* `ERL: Pre-refl.`: Follows a similar pattern to Post-refl. but is consistently lower, fluctuating between 0.60-0.70.
* `RLVR`: Starts ~0.30, rises to ~0.50 by step 20, then fluctuates noisily between 0.45-0.55.
* **SOKOBAN (Top-Right):**
* **Trend Verification:** ERL lines show a delayed but very sharp increase. RLVR remains near zero throughout.
* **Data Points (Approximate):**
* `ERL: Post-refl.`: Near 0 until step ~60, then rises sharply to ~0.80 by step 140, ending near 0.90.
* `ERL: Pre-refl.`: Follows a similar delayed rise but is lower, reaching ~0.75 by step 200.
* `RLVR`: Hovers near 0.00 for the entire 200 steps.
**2. Bottom Row: Olmo-3-7B-Instruct Model**
* **FROZENLAKE (Bottom-Left):**
* **Trend Verification:** All lines show a gradual, noisy upward trend. ERL lines are distinctly higher than RLVR.
* **Data Points (Approximate):**
* `ERL: Post-refl.`: Starts ~0.30, ends near 0.50.
* `ERL: Pre-refl.`: Starts ~0.18, ends near 0.44.
* `RLVR`: Starts ~0.18, ends near 0.36.
* **HOTPOTQA (Bottom-Middle):**
* **Trend Verification:** Similar pattern to the Qwen model on HOTPOTQA: rapid initial rise, then noisy plateaus with ERL leading.
* **Data Points (Approximate):**
* `ERL: Post-refl.`: Rises to ~0.60 by step 20, fluctuates between 0.55-0.65.
* `ERL: Pre-refl.`: Rises to ~0.55 by step 20, fluctuates between 0.50-0.60.
* `RLVR`: Rises to ~0.50 by step 20, fluctuates between 0.45-0.55.
* **SOKOBAN (Bottom-Right):**
* **Trend Verification:** ERL lines show high volatility with a general upward trend. RLVR shows a slight downward trend.
* **Data Points (Approximate):**
* `ERL: Post-refl.`: Highly volatile, ranging from ~0.04 to a peak near 0.14, ending around 0.10.
* `ERL: Pre-refl.`: Also volatile but generally lower than Post-refl., ranging from ~0.02 to 0.12.
* `RLVR`: Starts near 0.03, shows a slight decline, ending near 0.00.
### Key Observations
1. **Consistent Hierarchy:** In all six charts, the `ERL: Post-refl.` method (dark green) achieves the highest final reward, followed by `ERL: Pre-refl.` (light green), with `RLVR` (blue) performing the worst.
2. **Environment Difficulty:** The SOKOBAN environment appears to be the most challenging, especially for the RLVR method, which fails to learn (reward ~0) in both models. ERL methods show a significant learning delay in SOKOBAN with the Qwen model.
3. **Model Comparison:** The Qwen-3-4B model achieves higher absolute reward values (e.g., near 1.0 in FROZENLAKE) compared to the Olmo-3-7B model (max ~0.50 in FROZENLAKE), suggesting the tasks or reward scales may differ, or the Qwen model is more capable for these specific tasks.
4. **Learning Dynamics:** ERL methods typically show faster initial learning (steeper slopes) and higher asymptotic performance than RLVR. The "Post-refl." variant consistently offers a performance boost over "Pre-refl.".
### Interpretation
The data strongly suggests that the **ERL (Evolutionary Reinforcement Learning) methodology, particularly with post-reflection ("Post-refl."), is significantly more effective than the RLVR baseline** for training the evaluated language models on these sequential decision-making and reasoning tasks (FROZENLAKE, SOKOBAN, HOTPOTQA).
The consistent performance gap indicates that the evolutionary and reflective components of ERL provide a more robust learning signal or exploration strategy. The dramatic failure of RLVR in SOKOBAN highlights its potential inadequacy for sparse-reward, long-horizon planning tasks, where ERL's population-based approach may excel. The volatility in the Olmo-3-7B SOKOBAN chart suggests less stable training for that model-environment-method combination. Overall, the charts present compelling evidence for the superiority of the proposed ERL framework over the RLVR alternative across diverse tasks and model architectures.