## Diagram: Channel-wise and Coupled Quantization Techniques
### Overview
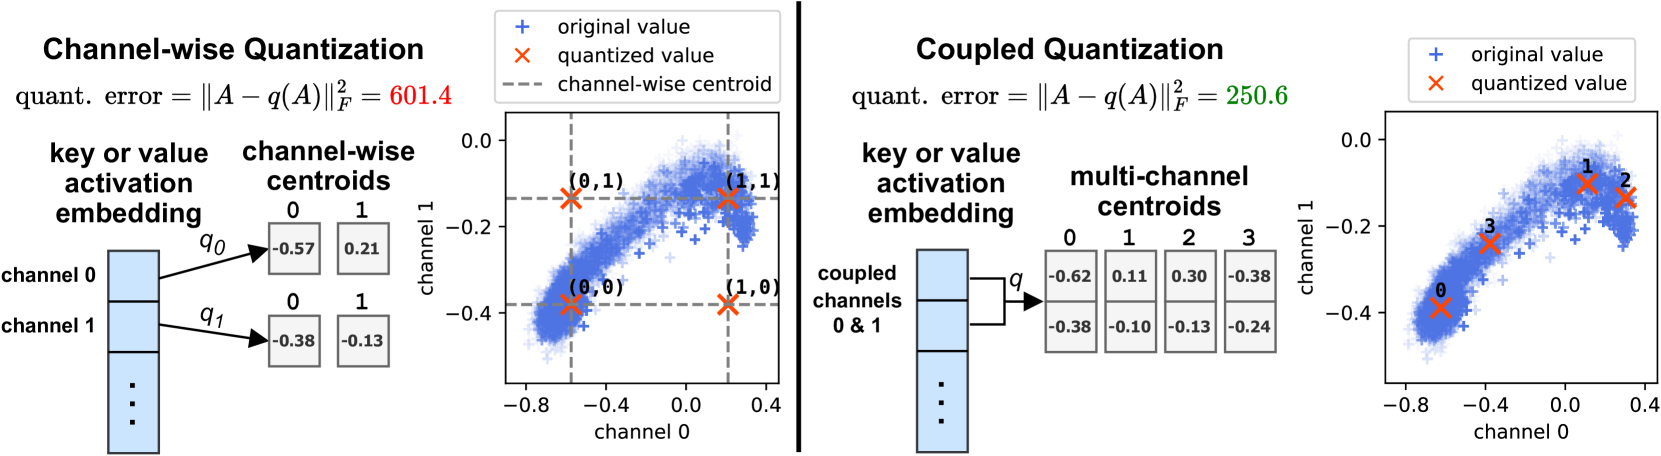
The image compares two quantization methods: **Channel-wise Quantization** (left) and **Coupled Quantization** (right). Each section includes a diagram of activation embedding and centroids, along with a scatter plot showing original (blue "+") and quantized (red "×") values. Quantization errors are explicitly labeled for both methods.
---
### Components/Axes
#### Left Section: Channel-wise Quantization
- **Diagram Labels**:
- "key or value activation embedding" (input)
- "channel-wise centroids" (output)
- Channels: 0, 1, ... (vertical axis)
- Centroid values:
- Channel 0: `q₀ = [-0.57, 0.21]`
- Channel 1: `q₁ = [-0.38, -0.13]`
- Quantization error: `601.4` (red text)
- **Scatter Plot**:
- **Axes**:
- X-axis: "channel 0" (range: -0.8 to 0.4)
- Y-axis: "channel 1" (range: -0.4 to 0.0)
- **Legend**:
- Blue "+": original values
- Red "×": quantized values
- Dashed lines: channel-wise centroids
#### Right Section: Coupled Quantization
- **Diagram Labels**:
- "coupled channels 0 & 1" (input)
- "multi-channel centroids" (output)
- Centroid values:
- `[-0.62, 0.11, 0.30, -0.38, -0.10, -0.13, -0.24]`
- Quantization error: `250.6` (green text)
- **Scatter Plot**:
- **Axes**:
- X-axis: "channel 0" (range: -0.8 to 0.4)
- Y-axis: "channel 1" (range: -0.4 to 0.0)
- **Legend**:
- Blue "+": original values
- Red "×": quantized values
---
### Detailed Analysis
#### Channel-wise Quantization
- **Centroids**:
- Channel 0: Two centroids at `(-0.57, 0.21)` and `(0, 1)`.
- Channel 1: Two centroids at `(-0.38, -0.13)` and `(0, 1)`.
- **Quantization Error**: `601.4` (high error, indicating poor approximation).
- **Scatter Plot Trends**:
- Original values (blue "+") form a curved distribution.
- Quantized values (red "×") cluster near centroids, with significant deviation from original data.
#### Coupled Quantization
- **Centroids**:
- Seven centroids across channels 0 and 1 (e.g., `(-0.62, 0.11, 0.30, ...)`).
- **Quantization Error**: `250.6` (lower error than channel-wise, suggesting better approximation).
- **Scatter Plot Trends**:
- Original values (blue "+") show similar curvature.
- Quantized values (red "×") align more closely with centroids, reducing deviation.
---
### Key Observations
1. **Quantization Error Reduction**:
- Coupled Quantization (`250.6`) achieves a **58% reduction** in error compared to Channel-wise (`601.4`).
2. **Centroid Distribution**:
- Channel-wise uses per-channel centroids, while Coupled uses multi-channel centroids, enabling finer granularity.
3. **Data Point Alignment**:
- In Coupled Quantization, quantized values (red "×") are closer to original values (blue "+") than in Channel-wise.
---
### Interpretation
- **Technical Insight**:
- Coupled Quantization improves accuracy by modeling inter-channel dependencies, whereas Channel-wise treats channels independently.
- **Practical Implications**:
- Lower quantization error in Coupled suggests better preservation of original data, critical for applications like neural networks where precision matters.
- **Anomalies**:
- No outliers in the scatter plots, but the centroid placement in Channel-wise (e.g., `(0, 1)`) may not align with data distribution, contributing to higher error.