\n
## Line Chart: Accuracy on ARC-C vs. Training Data Percentage
### Overview
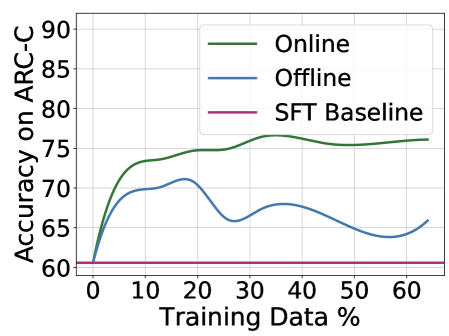
The image is a line chart comparing the performance of three different methods ("Online", "Offline", and "SFT Baseline") on the ARC-C benchmark as a function of the percentage of training data used. The chart demonstrates how accuracy changes with increasing data for each method.
### Components/Axes
* **Chart Type:** Line chart with three data series.
* **Y-Axis:**
* **Label:** "Accuracy on ARC-C"
* **Scale:** Linear, ranging from 60 to 90.
* **Major Tick Marks:** 60, 65, 70, 75, 80, 85, 90.
* **X-Axis:**
* **Label:** "Training Data %"
* **Scale:** Linear, ranging from 0 to 60.
* **Major Tick Marks:** 0, 10, 20, 30, 40, 50, 60.
* **Legend:**
* **Position:** Top-right corner of the plot area.
* **Items:**
1. **Online:** Represented by a solid green line.
2. **Offline:** Represented by a solid blue line.
3. **SFT Baseline:** Represented by a solid pink/magenta line.
### Detailed Analysis
**1. Online (Green Line):**
* **Trend:** Shows a rapid, steep increase in accuracy from 0% to approximately 10% training data, followed by a more gradual, steady increase that plateaus around 35-40% data. The line remains relatively flat with minor fluctuations from 40% to 60%.
* **Approximate Data Points:**
* At 0%: ~60
* At 10%: ~73
* At 20%: ~75
* At 30%: ~75
* At 40%: ~76 (Peak)
* At 50%: ~75
* At 60%: ~76
**2. Offline (Blue Line):**
* **Trend:** Also increases sharply from 0% to about 10% data, but then exhibits significant volatility. It peaks around 20% data, dips sharply around 30%, recovers slightly around 40%, dips again around 50%, and shows a slight upturn at 60%.
* **Approximate Data Points:**
* At 0%: ~60
* At 10%: ~69
* At 20%: ~71 (Peak)
* At 30%: ~66 (Local minimum)
* At 40%: ~68
* At 50%: ~64 (Global minimum after initial rise)
* At 60%: ~66
**3. SFT Baseline (Pink Line):**
* **Trend:** A perfectly horizontal line, indicating constant performance regardless of the training data percentage shown.
* **Approximate Data Point:** Constant at ~60 across the entire x-axis (0% to 60%).
### Key Observations
1. **Performance Hierarchy:** The "Online" method consistently achieves the highest accuracy after the initial training phase (~5% data onward). The "Offline" method performs worse than "Online" but better than the baseline for most data points, except at its lowest dips. The "SFT Baseline" shows no improvement.
2. **Data Efficiency:** Both "Online" and "Offline" methods show their most significant gains with the first 10-20% of training data.
3. **Stability:** The "Online" method demonstrates stable, monotonic improvement after the initial phase. The "Offline" method is highly unstable, with large swings in accuracy as more data is added, suggesting potential issues with optimization or data utilization.
4. **Baseline Ceiling:** The flat baseline at ~60 suggests that the starting model (SFT) has a fixed performance ceiling on this task that is not broken by simply adding more of the same training data without the "Online" or "Offline" adaptation strategies.
### Interpretation
This chart likely illustrates the results of an experiment in machine learning, specifically in adapting a pre-trained model (the SFT Baseline) to a new task (ARC-C). The key finding is that **active adaptation strategies ("Online" and "Offline") are crucial for improving performance beyond the baseline**, and that the **"Online" strategy is significantly more effective and stable** than the "Offline" one.
The "Online" method's curve is characteristic of successful learning: rapid initial gain followed by diminishing returns as it approaches an asymptotic performance limit. The "Offline" method's erratic behavior could indicate problems such as catastrophic forgetting, unstable training dynamics, or poor handling of data distribution shifts as the training set grows. The experiment demonstrates that not all adaptation methods are equal, and the choice between "Online" and "Offline" processing has a major impact on final model accuracy and reliability. The fact that both methods start at the same point as the baseline (60% at 0% data) confirms they are being evaluated from the same starting model.