## Line Graph: Accuracy on ARC-C vs Training Data %
### Overview
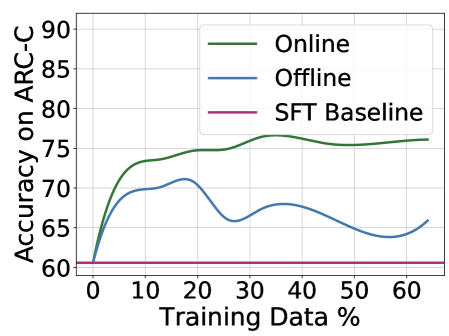
The image is a line graph comparing the accuracy of three methods ("Online," "Offline," and "SFT Baseline") on the ARC-C benchmark as training data percentage increases from 0% to 60%. The y-axis represents accuracy (60–90%), and the x-axis represents training data percentage (0–60%). The graph includes a legend in the top-right corner.
### Components/Axes
- **X-axis (Training Data %)**: Labeled "Training Data %," with markers at 0, 10, 20, 30, 40, 50, and 60.
- **Y-axis (Accuracy on ARC-C)**: Labeled "Accuracy on ARC-C," with markers at 60, 65, 70, 75, 80, 85, and 90.
- **Legend**: Located in the top-right corner, with three entries:
- **Green line**: "Online"
- **Blue line**: "Offline"
- **Pink line**: "SFT Baseline"
### Detailed Analysis
1. **Online (Green Line)**:
- Starts at ~60% accuracy at 0% training data.
- Rises sharply to ~75% by 10% training data.
- Plateaus with minor fluctuations (~75–76%) from 20% to 60% training data.
- Final accuracy at 60% training data: ~76%.
2. **Offline (Blue Line)**:
- Begins at ~60% accuracy at 0% training data.
- Peaks at ~70% around 20% training data.
- Declines to ~65% at 30% training data, then fluctuates between ~65–68% until 60% training data.
- Final accuracy at 60% training data: ~66%.
3. **SFT Baseline (Pink Line)**:
- Remains flat at ~60% accuracy across all training data percentages.
### Key Observations
- The **Online** method consistently outperforms the other two, achieving the highest accuracy (~76% at 60% training data).
- The **Offline** method shows variability, with a peak at 20% training data but a general decline afterward.
- The **SFT Baseline** remains static, indicating no improvement with increased training data.
### Interpretation
The data suggests that the **Online** method is the most effective for improving accuracy on ARC-C, likely due to dynamic adaptation during training. The **Offline** method’s initial improvement followed by decline may indicate overfitting or instability with limited data. The **SFT Baseline**’s flat line implies it lacks the capacity to learn from additional data, serving as a lower bound for comparison. The stark contrast between Online and SFT Baseline highlights the importance of online learning mechanisms in this context.