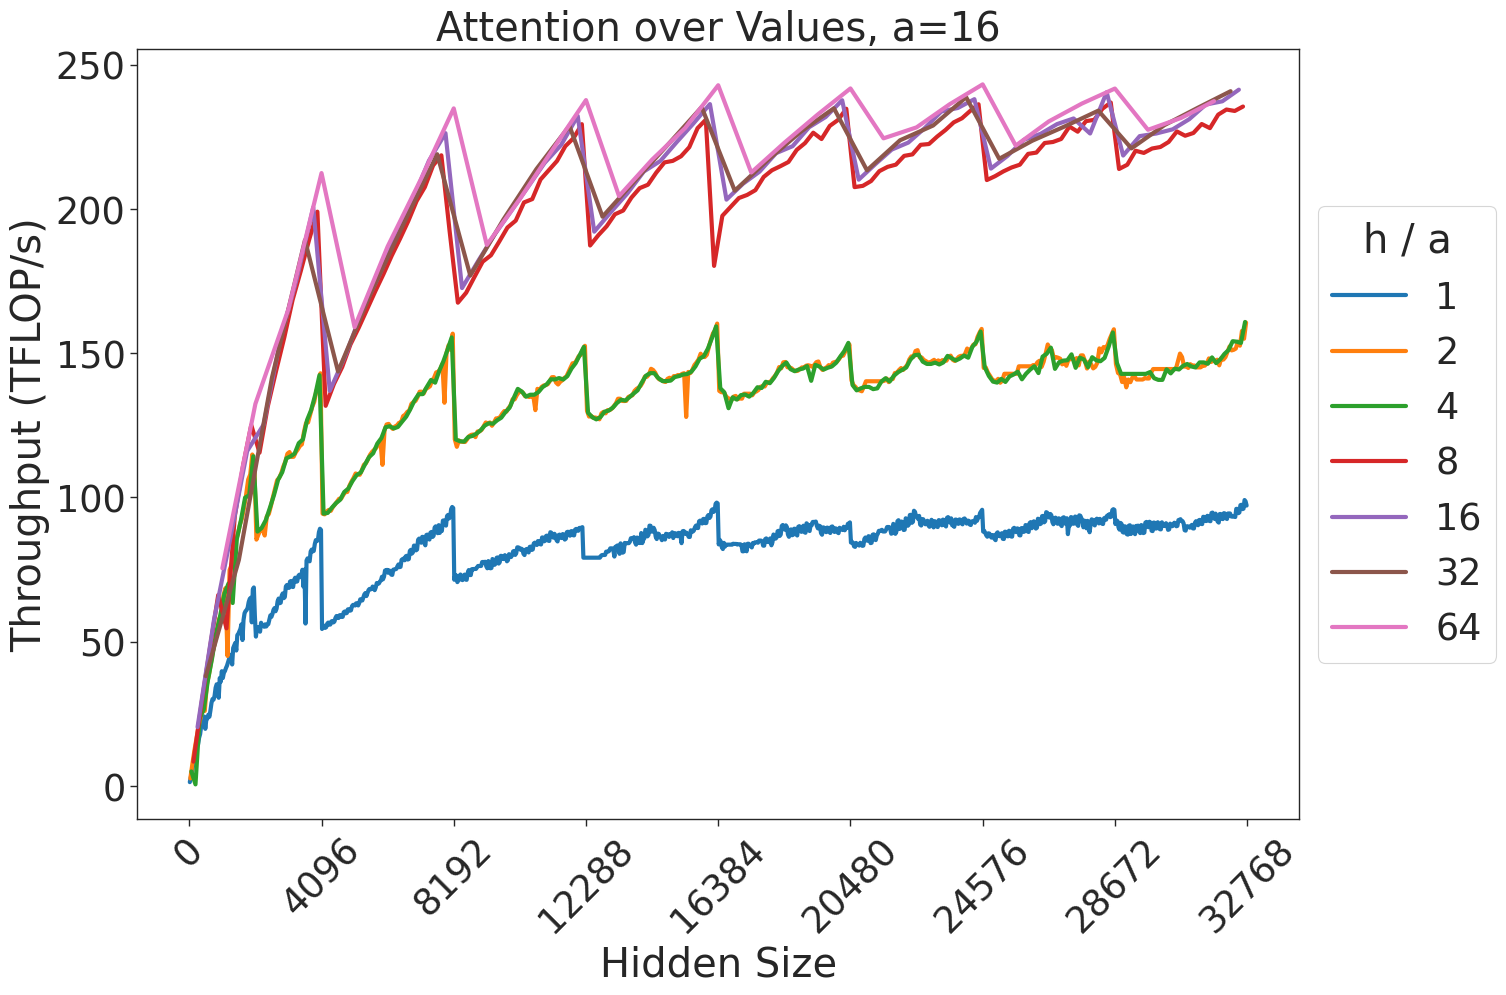
## Line Chart: Attention over Values, a=16
### Overview
This image is a performance benchmark line chart illustrating the relationship between "Hidden Size" and "Throughput (TFLOP/s)" for different "h / a" ratios. The chart displays a distinct "sawtooth" pattern across all data series, indicating periodic performance drops followed by recovery as the hidden size increases.
### Components/Axes
* **Title:** "Attention over Values, a=16" (Centered at the top).
* **X-Axis:** Labeled "Hidden Size". The scale ranges from 0 to 32768. Major tick marks are provided at intervals of 4096 (0, 4096, 8192, 12288, 16384, 20480, 24576, 28672, 32768). The labels are rotated 45 degrees.
* **Y-Axis:** Labeled "Throughput (TFLOP/s)". The scale ranges from 0 to 250, with major grid lines at intervals of 50.
* **Legend:** Located on the right side of the chart. It is titled "h / a" and lists seven categories corresponding to different colored lines:
* **Blue:** 1
* **Orange:** 2
* **Green:** 4
* **Red:** 8
* **Purple:** 16
* **Brown:** 32
* **Pink:** 64
### Detailed Analysis
The chart displays seven data series, which can be grouped into three distinct performance tiers based on their throughput values.
**Trend Verification:**
All seven lines exhibit a general upward trend as the Hidden Size increases. However, every line is characterized by a recurring "sawtooth" pattern: a sharp, near-vertical drop in throughput followed by a steep, linear-like recovery.
**Data Series Grouping and Values:**
1. **Bottom Tier (Blue line, h/a=1):**
* **Trend:** This line is the lowest performer. It starts near 0 and climbs to approximately 100 TFLOP/s at a Hidden Size of 32768.
* **Sawtooth behavior:** The drops are frequent and distinct, often dipping by 10-20 TFLOP/s.
2. **Middle Tier (Orange and Green lines, h/a=2 and 4):**
* **Trend:** These two lines overlap significantly. They show higher throughput than the blue line, reaching approximately 150-160 TFLOP/s at the maximum Hidden Size.
* **Sawtooth behavior:** The drops are more pronounced than the blue line, often dipping by 20-30 TFLOP/s.
3. **Top Tier (Red, Purple, Brown, Pink lines, h/a=8, 16, 32, 64):**
* **Trend:** These four lines are tightly clustered at the top of the chart. They show the highest performance, reaching approximately 230-240 TFLOP/s at the maximum Hidden Size.
* **Sawtooth behavior:** These lines exhibit the most dramatic drops, often falling from ~240 TFLOP/s down to ~180-200 TFLOP/s before recovering.
### Key Observations
* **Clustering:** There is a clear saturation point. Increasing the "h/a" ratio beyond 8 yields diminishing returns, as the lines for 8, 16, 32, and 64 are nearly indistinguishable.
* **Periodic Drops:** The "sawtooth" drops occur at regular intervals along the X-axis. These intervals appear to align with powers of 2 or specific block-size boundaries (e.g., around 4096, 8192, etc.).
* **Performance Ceiling:** The maximum throughput across all configurations appears to be capped around 240-250 TFLOP/s.
### Interpretation
This chart likely represents a performance benchmark for a GPU-accelerated attention mechanism (such as FlashAttention).
* **The "Sawtooth" Effect:** The periodic drops in throughput are characteristic of memory tiling or block-size limitations in GPU kernels. When the "Hidden Size" exceeds a specific memory block boundary, the kernel must re-allocate or change its tiling strategy, causing a temporary performance penalty.
* **h/a Ratio:** The "h/a" ratio likely represents the number of attention heads (h) relative to a parameter 'a' (which is fixed at 16). The data suggests that increasing the number of heads (or the ratio) improves throughput up to a point (h/a=8), after which the hardware is likely compute-bound or memory-bandwidth-bound, resulting in the observed clustering of the top four lines.
* **Optimization Insight:** For developers or researchers, this chart demonstrates that choosing an "h/a" ratio of 8 or higher provides optimal throughput, but one must be aware of the "sawtooth" performance dips at specific hidden size boundaries to avoid performance instability in production workloads.