## Line Graph: Surprisal vs Training Steps
### Overview
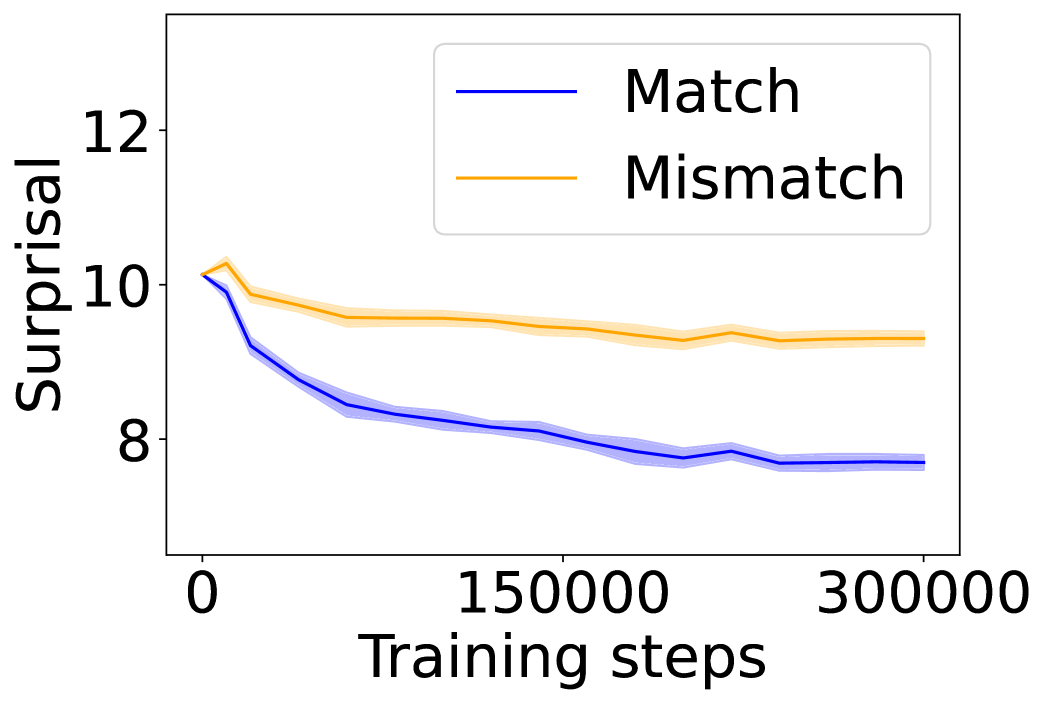
The image depicts a line graph comparing two data series ("Match" and "Mismatch") across 300,000 training steps. The y-axis measures "Surprisal" (0-12), while the x-axis tracks "Training steps" (0-300,000). Two shaded confidence intervals accompany each line, indicating measurement uncertainty.
### Components/Axes
- **Y-axis (Surprisal)**: Linear scale from 8 to 12, with ticks at 8, 10, and 12.
- **X-axis (Training steps)**: Linear scale from 0 to 300,000, with ticks at 0, 150,000, and 300,000.
- **Legend**: Located in the top-right corner, with:
- **Blue line**: "Match" (solid blue)
- **Orange line**: "Mismatch" (solid orange)
- **Shaded regions**: Gray bands around each line represent 95% confidence intervals.
### Detailed Analysis
1. **Match (Blue Line)**:
- Starts at **10.0** (x=0) with a steep decline.
- Drops to **8.5** at 150,000 steps, then plateaus near **8.0** by 300,000 steps.
- Confidence interval narrows from ±0.5 at x=0 to ±0.2 at x=300,000.
2. **Mismatch (Orange Line)**:
- Begins at **10.0** (x=0) with a slight dip to **9.5** at 150,000 steps.
- Stabilizes at **9.3** by 300,000 steps, showing minimal change.
- Confidence interval remains consistent at ±0.3 throughout.
### Key Observations
- **Match** demonstrates a **20% reduction** in surprisal over training steps, while **Mismatch** shows only a **7% reduction**.
- The **blue line** (Match) exhibits a **non-linear decline**, with the steepest drop occurring in the first 50,000 steps.
- **Mismatch** maintains a **flat trajectory** after 150,000 steps, suggesting diminishing returns in training.
### Interpretation
The data suggests that "Match" conditions (likely aligned with training objectives) lead to **significant performance improvement** over time, as measured by decreasing surprisal. The "Mismatch" condition shows **limited adaptation**, maintaining higher surprisal values despite training. The narrowing confidence intervals for "Match" indicate increasing measurement precision as training progresses. This pattern aligns with machine learning principles where model parameters better align with training data over iterations, reducing uncertainty in predictions.