## Box Plot: MUSHRA Score Distribution by Intended Angle
### Overview
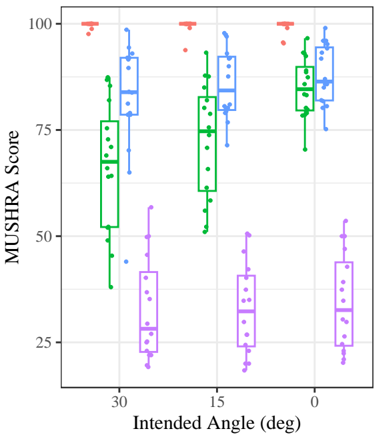
The image displays a box plot comparing MUSHRA scores across three intended angles (30°, 15°, 0°). Four distinct color-coded data series (red, blue, green, purple) are plotted, with outliers marked as individual points. The y-axis ranges from 25 to 100, while the x-axis categorizes data by angle.
### Components/Axes
- **X-axis (Intended Angle)**: Labeled "Intended Angle (deg)" with categories at 30°, 15°, and 0°.
- **Y-axis (MUSHRA Score)**: Labeled "MUSHRA Score" with a scale from 25 to 100.
- **Legend**: Located on the right, associating colors with data series:
- Red: Highest median scores (30°)
- Blue: Mid-range scores (15°)
- Green: Lower scores (0°)
- Purple: Lowest scores (0°)
- **Outliers**: Red dots above 100 (exceeding y-axis range).
### Detailed Analysis
1. **30° (Red)**:
- Median ~85 (IQR: ~75–90).
- Outliers: 3 points above 100 (potential data anomalies).
- High variability (long whiskers).
2. **15° (Blue)**:
- Median ~75 (IQR: ~65–85).
- Moderate variability (shorter whiskers than 30°).
3. **0° (Green/Purple)**:
- Green: Median ~65 (IQR: ~50–75).
- Purple: Median ~30 (IQR: ~25–40).
- Significant drop in scores compared to higher angles.
### Key Observations
- **Trend**: MUSHRA scores decrease as intended angle decreases (30° > 15° > 0°).
- **Outliers**: Red points above 100 suggest potential measurement errors or exceptional cases.
- **Color Coding**: Purple series (0°) shows the lowest performance, while red (30°) dominates higher scores.
### Interpretation
The data suggests that higher intended angles correlate with better MUSHRA scores, likely reflecting user preference or system performance. The purple series (0°) indicates a critical drop in perceived quality, possibly due to alignment issues or technical limitations. Outliers above 100 warrant investigation—could they represent miscalibrations or biased evaluations? The color-coded groups may represent different experimental conditions (e.g., user groups, systems), but the legend lacks explicit labels, limiting interpretability. Further analysis is needed to confirm causal relationships between angle and score.