## Line Chart: Model Performance Comparison Across Evaluation Metrics
### Overview
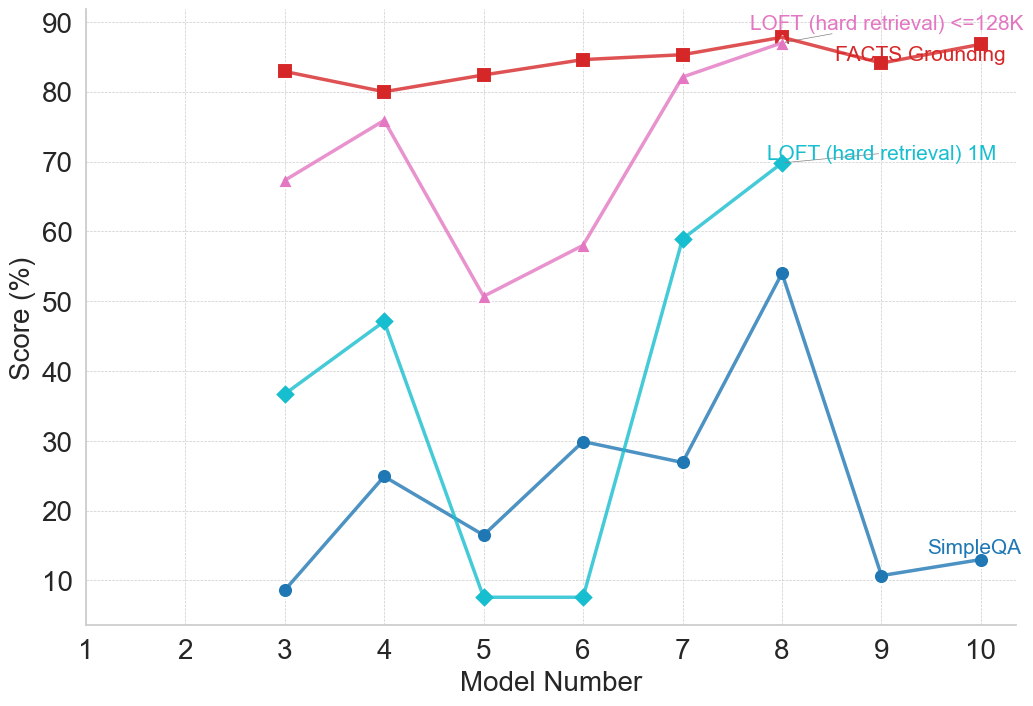
This image is a line chart comparing the performance scores (in percentage) of ten different models (labeled 1 through 10) across four distinct evaluation metrics or benchmarks. The chart visualizes how each model's score varies by metric, revealing performance patterns and disparities.
### Components/Axes
* **Chart Type:** Multi-series line chart with markers.
* **X-Axis (Horizontal):**
* **Label:** "Model Number"
* **Scale:** Linear, discrete integers from 1 to 10.
* **Markers:** Major tick marks at each integer from 1 to 10.
* **Y-Axis (Vertical):**
* **Label:** "Score (%)"
* **Scale:** Linear, ranging from 0 to 90.
* **Markers:** Major tick marks at intervals of 10 (0, 10, 20, ..., 90).
* **Legend:** Located in the top-right quadrant of the chart area. It contains four entries, each associating a colored line and marker shape with a metric name.
1. **Red line with square markers:** "FACTS Grounding"
2. **Pink line with upward-pointing triangle markers:** "LOFT (hard retrieval) <=128K"
3. **Cyan line with diamond markers:** "LOFT (hard-retrieval) 1M"
4. **Blue line with circle markers:** "SimpleQA"
### Detailed Analysis
**Data Series and Approximate Values:**
The following values are approximate, read from the chart's grid.
1. **FACTS Grounding (Red, Squares):**
* **Trend:** Relatively stable and high-performing across all models, with a slight upward trend from Model 3 to Model 8.
* **Data Points:**
* Model 3: ~83%
* Model 4: ~80%
* Model 5: ~82%
* Model 6: ~84%
* Model 7: ~85%
* Model 8: ~88%
* Model 9: ~84%
* Model 10: ~87%
2. **LOFT (hard retrieval) <=128K (Pink, Triangles):**
* **Trend:** Highly variable. Starts high, dips sharply at Model 5, then recovers strongly to peak at Model 8.
* **Data Points:**
* Model 3: ~67%
* Model 4: ~76%
* Model 5: ~50%
* Model 6: ~58%
* Model 7: ~82%
* Model 8: ~88%
* (No data points visible for Models 9 and 10 for this series).
3. **LOFT (hard-retrieval) 1M (Cyan, Diamonds):**
* **Trend:** Shows significant volatility. Has a local peak at Model 4, a deep trough at Models 5 & 6, then a very sharp rise to its highest point at Model 8.
* **Data Points:**
* Model 3: ~37%
* Model 4: ~47%
* Model 5: ~7%
* Model 6: ~7%
* Model 7: ~59%
* Model 8: ~70%
* (No data points visible for Models 9 and 10 for this series).
4. **SimpleQA (Blue, Circles):**
* **Trend:** Generally lower scores than the other metrics, with a notable peak at Model 8 and a sharp drop at Model 9.
* **Data Points:**
* Model 3: ~8%
* Model 4: ~25%
* Model 5: ~16%
* Model 6: ~30%
* Model 7: ~27%
* Model 8: ~54%
* Model 9: ~10%
* Model 10: ~13%
### Key Observations
* **Model 8 is a Peak Performer:** All four metrics show their highest or near-highest scores for Model 8, suggesting it is the strongest model overall across these diverse tasks.
* **Metric Difficulty Hierarchy:** There is a clear and consistent separation in score ranges between the metrics. "FACTS Grounding" yields the highest scores (mostly 80-90%), followed by the two "LOFT" variants (spanning ~7% to 88%), with "SimpleQA" consistently producing the lowest scores (mostly below 30%, except for Model 8).
* **High Volatility in Retrieval Tasks:** The two "LOFT (hard-retrieval)" metrics show the most dramatic swings in performance between models, particularly the severe drop at Models 5 & 6 for the 1M variant.
* **Anomaly at Model 9:** While "FACTS Grounding" remains high, "SimpleQA" performance plummets to near its lowest point at Model 9, indicating a specific weakness for that model on this particular benchmark.
### Interpretation
This chart likely compares different AI or language models on a battery of tests designed to evaluate specific capabilities. The data suggests:
1. **Task-Specific Performance:** A model's proficiency is highly dependent on the type of task. A model excellent at "FACTS Grounding" (likely factual recall or verification) may not excel at "SimpleQA" (possibly open-domain question answering) or complex retrieval tasks ("LOFT").
2. **The "LOFT" Benchmarks are Discriminative:** The wide score variance for the LOFT metrics indicates they are effective at differentiating model capabilities, especially for retrieval over long contexts (1M vs. <=128K). The poor performance of many models on the 1M variant at Models 5 & 6 highlights a potential scaling or context-handling challenge.
3. **Model 8's Robustness:** Model 8's strong, consistent performance across all four disparate metrics is noteworthy. It suggests a more generalized capability or a better overall architecture compared to the other models in this lineup.
4. **Benchmark Design Implications:** The consistent ranking of metric difficulty (FACTS > LOFT > SimpleQA) provides insight into the relative challenge these benchmarks pose to the current generation of models. "SimpleQA" appears to be the most challenging overall.
**In summary, the chart reveals that model evaluation is multifaceted. No single model leads in every category, but Model 8 demonstrates the most robust performance. The significant performance gaps between metrics underscore the importance of using diverse benchmarks to assess AI capabilities comprehensively.**