## Line Charts: Model Accuracy vs. Number of Interactions
### Overview
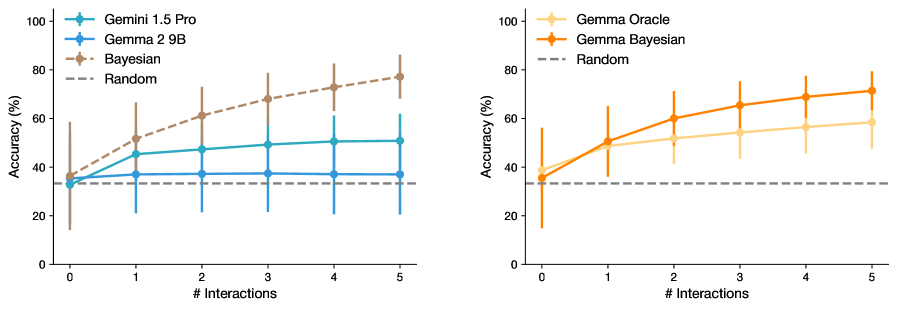
The image contains two side-by-side line charts comparing the performance (accuracy) of different AI models or methods over an increasing number of interactions. Both charts share the same axes and scale. The left chart compares Gemini 1.5 Pro, Gemma 2 9B, and a Bayesian method against a Random baseline. The right chart compares Gemma Oracle and Gemma Bayesian against the same Random baseline. All data series include error bars, indicating variability or confidence intervals.
### Components/Axes
**Common to Both Charts:**
* **X-Axis:** Label: "# Interactions". Scale: Linear, from 0 to 5, with integer markers at 0, 1, 2, 3, 4, 5.
* **Y-Axis:** Label: "Accuracy (%)". Scale: Linear, from 0 to 100, with major ticks at 0, 20, 40, 60, 80, 100.
* **Baseline:** A dashed grey line labeled "Random" is present in both charts at approximately 33% accuracy, serving as a constant reference point.
**Left Chart Legend (Position: Top-Left):**
1. **Gemini 1.5 Pro:** Teal line with circular markers.
2. **Gemma 2 9B:** Blue line with circular markers.
3. **Bayesian:** Brown line with circular markers.
4. **Random:** Dashed grey line.
**Right Chart Legend (Position: Top-Left):**
1. **Gemma Oracle:** Light orange line with circular markers.
2. **Gemma Bayesian:** Dark orange line with circular markers.
3. **Random:** Dashed grey line.
### Detailed Analysis
**Left Chart: Gemini 1.5 Pro vs. Gemma 2 9B vs. Bayesian**
* **Trend Verification:**
* **Bayesian (Brown):** Shows a strong, steady upward slope from interaction 0 to 5.
* **Gemini 1.5 Pro (Teal):** Shows a moderate upward slope that appears to plateau after interaction 3.
* **Gemma 2 9B (Blue):** Shows a shallow upward slope, plateauing early around interaction 2.
* **Random (Grey Dashed):** Flat horizontal line.
* **Data Points (Approximate values with ~ uncertainty):**
* **Interaction 0:** Bayesian ~35%, Gemini ~35%, Gemma ~30%.
* **Interaction 1:** Bayesian ~52%, Gemini ~45%, Gemma ~38%.
* **Interaction 2:** Bayesian ~61%, Gemini ~47%, Gemma ~38%.
* **Interaction 3:** Bayesian ~68%, Gemini ~49%, Gemma ~38%.
* **Interaction 4:** Bayesian ~73%, Gemini ~50%, Gemma ~38%.
* **Interaction 5:** Bayesian ~77%, Gemini ~50%, Gemma ~38%.
**Right Chart: Gemma Oracle vs. Gemma Bayesian**
* **Trend Verification:**
* **Gemma Bayesian (Dark Orange):** Shows a strong upward slope, similar in shape to the "Bayesian" line in the left chart.
* **Gemma Oracle (Light Orange):** Shows a moderate upward slope, less steep than Gemma Bayesian.
* **Random (Grey Dashed):** Flat horizontal line.
* **Data Points (Approximate values with ~ uncertainty):**
* **Interaction 0:** Both Gemma models start near ~35%.
* **Interaction 1:** Gemma Bayesian ~50%, Gemma Oracle ~50%.
* **Interaction 2:** Gemma Bayesian ~60%, Gemma Oracle ~51%.
* **Interaction 3:** Gemma Bayesian ~65%, Gemma Oracle ~54%.
* **Interaction 4:** Gemma Bayesian ~68%, Gemma Oracle ~57%.
* **Interaction 5:** Gemma Bayesian ~71%, Gemma Oracle ~59%.
### Key Observations
1. **Performance Hierarchy:** In the left chart, the Bayesian method significantly outperforms both Gemini 1.5 Pro and Gemma 2 9B after the first interaction. In the right chart, Gemma Bayesian consistently outperforms Gemma Oracle.
2. **Learning Curves:** All models (except Random) show improved accuracy with more interactions, but their rates of improvement differ markedly. The Bayesian approaches show the steepest and most sustained improvement.
3. **Plateaus:** Gemini 1.5 Pro and Gemma 2 9B appear to reach a performance plateau (around 50% and 38% respectively) after 2-3 interactions, suggesting limited further gain from additional interactions. The Bayesian methods show no clear plateau within the observed range.
4. **Starting Point:** All models begin at or above the Random baseline (~33%) at interaction 0, indicating some initial capability.
5. **Variability:** Error bars are present for all data points. The variability (length of error bars) appears relatively consistent across interactions for each series, though a precise quantification is not possible from the visual.
### Interpretation
The data suggests a clear advantage for Bayesian methods in this specific interactive learning or optimization task. The "Bayesian" and "Gemma Bayesian" models demonstrate superior sample efficiency, extracting more performance gain per interaction compared to the standard Gemini and Gemma models, and compared to the "Oracle" variant.
The plateauing of the non-Bayesian models indicates they may be hitting a performance ceiling inherent to their architecture or training for this task, whereas the Bayesian approaches continue to refine their accuracy. The consistent outperformance of "Gemma Bayesian" over "Gemma Oracle" is particularly noteworthy, as it suggests the Bayesian framework itself provides a benefit beyond what an "oracle" (which might imply access to privileged information) provides in this context.
The Random baseline at ~33% likely represents chance performance for a 3-class classification problem. The fact that all models start above this line at interaction 0 implies they possess some pre-existing knowledge or bias relevant to the task before any interactions occur.
**Language Declaration:** All text in the image is in English.