## Line Graph: Training Loss Over Steps
### Overview
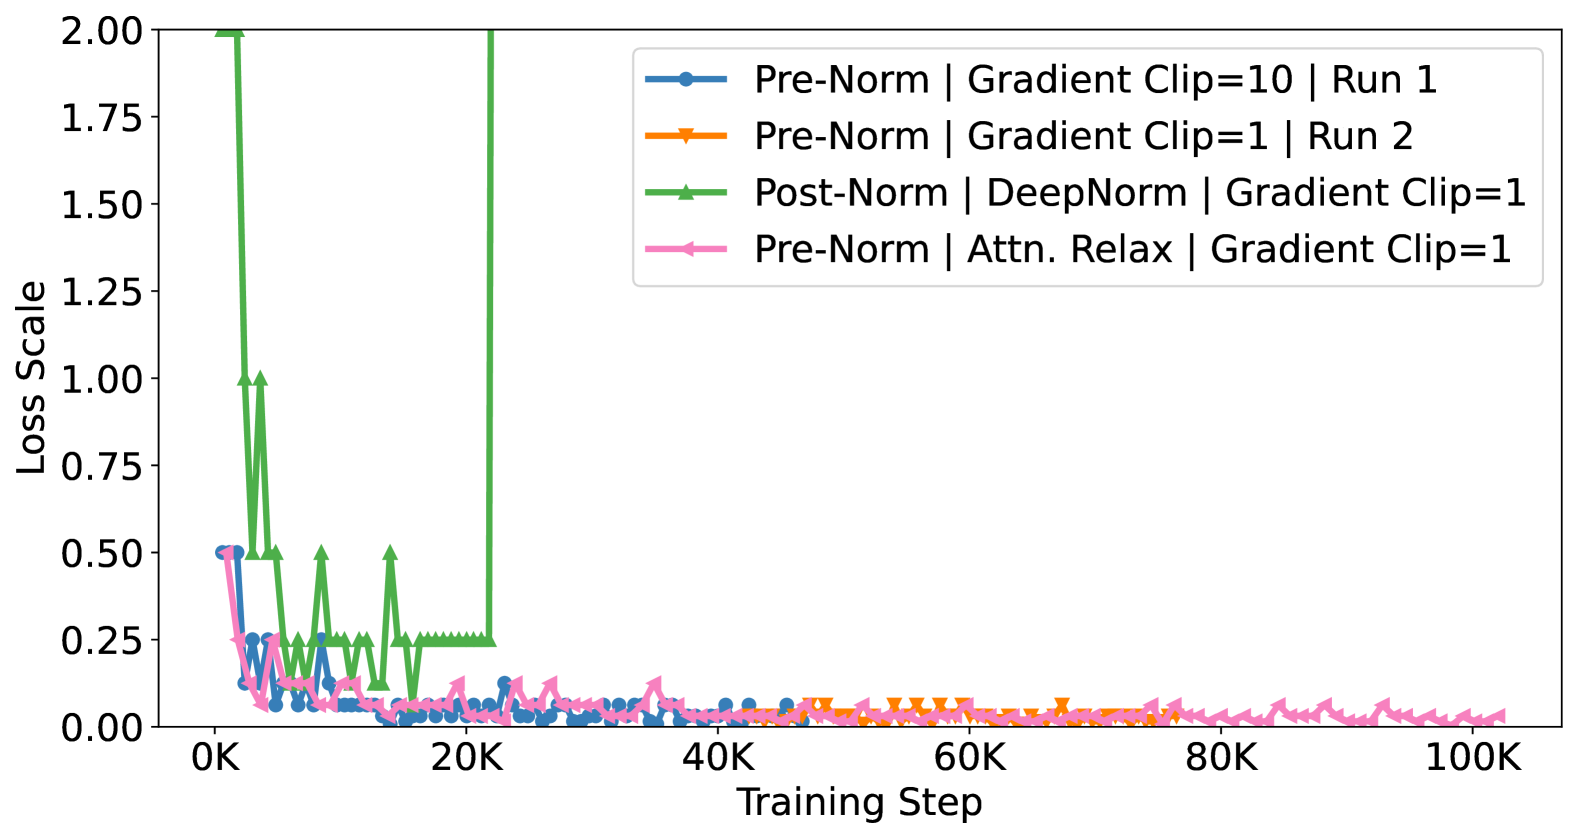
The image depicts a line graph comparing the convergence behavior of different normalization techniques and gradient clipping strategies during training. Four distinct data series are plotted against training steps (0K–100K) and loss scale (0.00–2.00). The graph highlights rapid initial loss reduction followed by stabilization across all methods.
### Components/Axes
- **X-axis**: Training Step (0K, 20K, 40K, 60K, 80K, 100K)
- **Y-axis**: Loss Scale (0.00, 0.25, 0.50, 0.75, 1.00, 1.25, 1.50, 1.75, 2.00)
- **Legend**: Located in the top-right corner, with four entries:
1. **Blue line**: Pre-Norm | Gradient Clip=10 | Run 1
2. **Orange line**: Pre-Norm | Gradient Clip=1 | Run 2
3. **Green line**: Post-Norm | DeepNorm | Gradient Clip=1
4. **Pink line**: Pre-Norm | Attn. Relax | Gradient Clip=1
### Detailed Analysis
1. **Blue Line (Gradient Clip=10)**:
- Starts at ~1.5 loss at 0K.
- Drops sharply to ~0.05 by 5K steps.
- Fluctuates slightly (~0.03–0.07) between 5K–20K.
- Stabilizes near 0.05 after 20K.
2. **Orange Line (Gradient Clip=1, Run 2)**:
- Begins at ~0.5 loss at 0K.
- Declines to ~0.05 by 10K.
- Remains stable (~0.03–0.07) after 10K.
3. **Green Line (Post-Norm, DeepNorm)**:
- Starts at ~2.0 loss at 0K.
- Drops to ~0.25 by 10K.
- Stabilizes near 0.05 after 20K.
4. **Pink Line (Attn. Relax)**:
- Begins at ~0.5 loss at 0K.
- Declines to ~0.05 by 10K.
- Stabilizes near 0.05 after 10K.
### Key Observations
- **Initial Divergence**: The green line (Post-Norm) starts with the highest loss (~2.0) but achieves the steepest early reduction (~1.75 loss drop in 5K steps).
- **Gradient Clip Impact**: The blue line (Gradient Clip=10) shows the fastest initial convergence (~1.45 loss drop in 5K steps), suggesting higher gradient clipping accelerates early training.
- **Stabilization**: All lines converge to ~0.05 loss after 20K steps, indicating similar long-term performance despite differing initial trajectories.
- **Anomaly**: The green line exhibits two sharp spikes (~1.75 loss) at 5K and 15K steps, possibly reflecting instability during early training phases.
### Interpretation
The data demonstrates that:
1. **Gradient Clipping Magnitude** significantly impacts early convergence speed (Gradient Clip=10 vs. Gradient Clip=1).
2. **Normalization Techniques** (Pre-Norm vs. Post-Norm) influence initial loss values but not final convergence.
3. **Attention Relaxation** (pink line) achieves comparable convergence to Gradient Clip=1 (orange line) despite different mechanisms.
4. The green line’s (Post-Norm) initial instability (spikes) suggests potential trade-offs between early-phase volatility and long-term stability.
This analysis implies that while normalization and gradient clipping strategies affect training dynamics, all methods ultimately achieve similar loss levels, with Gradient Clip=10 offering the fastest initial progress.