# Technical Data Extraction: JSD vs. Token Position Chart
## 1. General Description
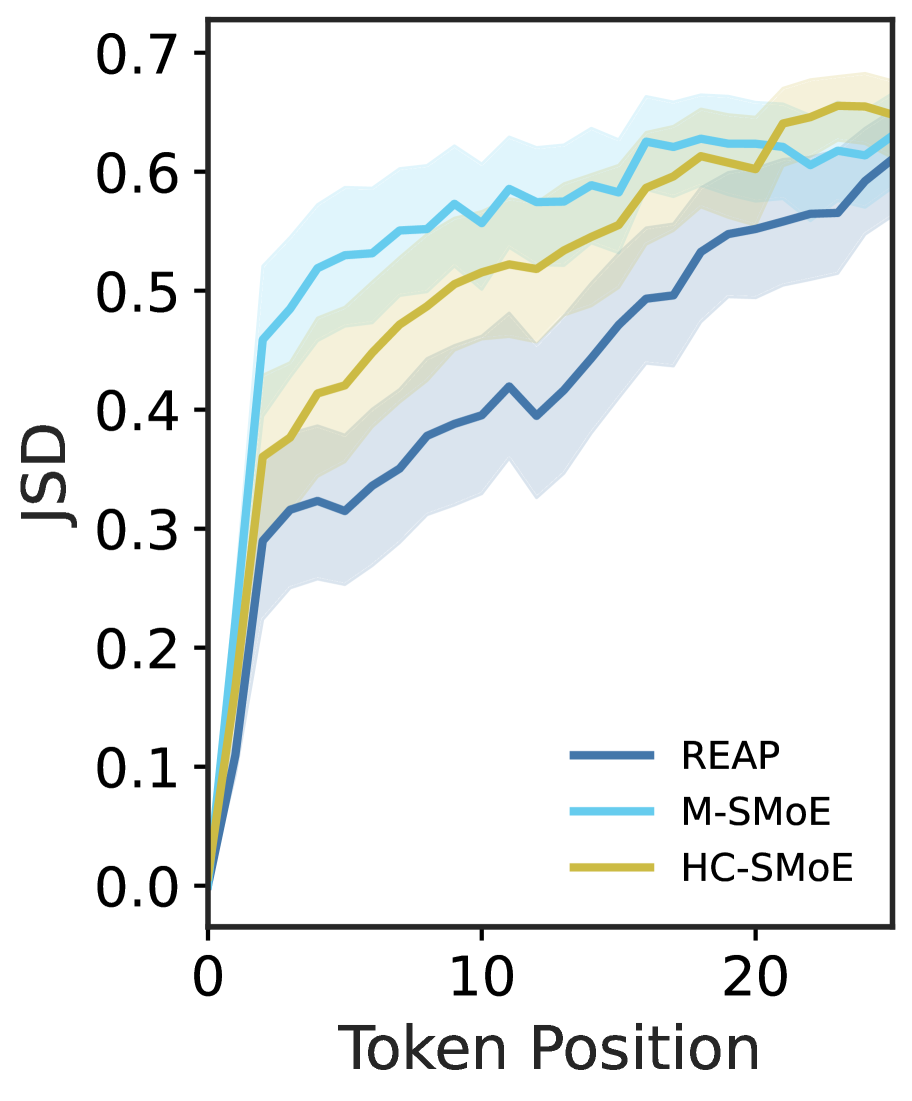
This image is a line graph illustrating the relationship between **Token Position** (x-axis) and **JSD** (Jensen-Shannon Divergence, y-axis) for three different models or methods. Each method is represented by a solid colored line accompanied by a semi-transparent shaded area indicating a confidence interval or variance.
## 2. Axis Information
* **Y-Axis Label:** JSD
* **Y-Axis Scale:** 0.0 to 0.7, with major tick marks every 0.1 units.
* **X-Axis Label:** Token Position
* **X-Axis Scale:** 0 to 25, with major tick marks every 10 units (0, 10, 20). The data points appear to be sampled at integer intervals from 0 to 25.
## 3. Legend and Data Series
The legend is located in the bottom-right quadrant of the plot:
| Series Label | Line Color | Shaded Area Color |
| :--- | :--- | :--- |
| **REAP** | Dark Blue | Light Blue-Grey |
| **M-SMoE** | Cyan / Light Blue | Very Light Cyan |
| **HC-SMoE** | Gold / Olive Yellow | Light Yellow-Green |
## 4. Key Trends and Data Points
All three series show a positive correlation, where JSD increases as the Token Position increases, eventually showing signs of plateauing or slowing growth toward the end of the sequence.
### REAP (Dark Blue)
* **Initial State:** Starts at (0, 0).
* **Growth:** Shows the slowest initial growth compared to the other two models.
* **Mid-point:** Reaches a JSD of approximately 0.4 at Token Position 10.
* **Final State:** Ends at a JSD of approximately 0.6 at Token Position 25.
* **Variance:** Maintains a relatively consistent shaded variance band throughout the sequence.
### M-SMoE (Cyan)
* **Initial State:** Starts at (0, 0).
* **Growth:** Exhibits the sharpest initial increase, jumping to ~0.45 by Token Position 2.
* **Mid-point:** Reaches a JSD of approximately 0.55–0.58 at Token Position 10.
* **Final State:** Ends at a JSD of approximately 0.63 at Token Position 25.
* **Trend:** This model maintains the highest JSD values for the majority of the sequence (from position 1 to 20).
### HC-SMoE (Gold)
* **Initial State:** Starts at (0, 0).
* **Growth:** Growth rate is intermediate between REAP and M-SMoE.
* **Mid-point:** Reaches a JSD of approximately 0.5 at Token Position 10.
* **Final State:** Ends at the highest final JSD value of approximately 0.65 at Token Position 25.
* **Trend:** While it starts lower than M-SMoE, it converges with and slightly overtakes M-SMoE around Token Position 22.
## 5. Comparative Analysis
* **Early Sequence (0-5):** M-SMoE has the highest JSD, followed by HC-SMoE, with REAP being the lowest.
* **Late Sequence (20-25):** HC-SMoE and M-SMoE converge at the top of the scale (0.6-0.65), while REAP remains the lowest (0.55-0.6).
* **Uncertainty:** The shaded regions for all three models overlap significantly after Token Position 15, suggesting that the performance differences between the models become less statistically distinct as the sequence length increases.