## Bar Chart: Drop (%) of AUROC for Different QA Datasets and Models
### Overview
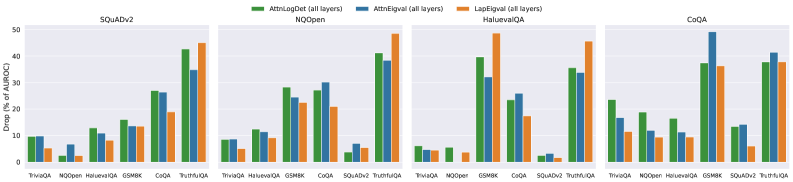
The image presents a series of four bar charts, each representing a different Question Answering (QA) dataset: SQuADv2, NQOpen, HaluevalQA, and CoQA. Each chart compares the performance of three models – AttnLagDet (all layers), AttnEqual (all layers), and LapEqual (all layers) – based on the Drop (%) of Area Under the Receiver Operating Characteristic curve (AUROC). The charts visually compare the performance of these models across different QA datasets.
### Components/Axes
* **X-axis:** Represents different QA models: TriviaQA, Moopen, HaluevalQA, GSM8K, SQuAD, TruthQA, and PI/10.
* **Y-axis:** Represents "Drop (%) of AUROC", ranging from 0 to 50.
* **Legend:** Located at the top-center of the image, identifies the three models using color-coding:
* Green: AttnLagDet (all layers)
* Blue: AttnEqual (all layers)
* Orange: LapEqual (all layers)
* **Titles:** Each chart is labeled with the corresponding QA dataset name (SQuADv2, NQOpen, HaluevalQA, CoQA) positioned at the top-center.
### Detailed Analysis or Content Details
**SQuADv2 Chart:**
* TriviaQA: AttnLagDet ≈ 1.5%, AttnEqual ≈ 1.0%, LapEqual ≈ 1.0%
* Moopen: AttnLagDet ≈ 2.0%, AttnEqual ≈ 1.5%, LapEqual ≈ 1.5%
* HaluevalQA: AttnLagDet ≈ 10.0%, AttnEqual ≈ 6.0%, LapEqual ≈ 5.0%
* GSM8K: AttnLagDet ≈ 15.0%, AttnEqual ≈ 10.0%, LapEqual ≈ 8.0%
* SQuAD: AttnLagDet ≈ 42.0%, AttnEqual ≈ 30.0%, LapEqual ≈ 25.0%
* TruthQA: AttnLagDet ≈ 35.0%, AttnEqual ≈ 25.0%, LapEqual ≈ 20.0%
* PI/10: AttnLagDet ≈ 45.0%, AttnEqual ≈ 35.0%, LapEqual ≈ 30.0%
**NQOpen Chart:**
* TriviaQA: AttnLagDet ≈ 1.0%, AttnEqual ≈ 0.5%, LapEqual ≈ 0.5%
* Moopen: AttnLagDet ≈ 1.5%, AttnEqual ≈ 1.0%, LapEqual ≈ 1.0%
* HaluevalQA: AttnLagDet ≈ 5.0%, AttnEqual ≈ 3.0%, LapEqual ≈ 2.0%
* GSM8K: AttnLagDet ≈ 15.0%, AttnEqual ≈ 10.0%, LapEqual ≈ 8.0%
* SQuAD: AttnLagDet ≈ 30.0%, AttnEqual ≈ 20.0%, LapEqual ≈ 15.0%
* TruthQA: AttnLagDet ≈ 25.0%, AttnEqual ≈ 15.0%, LapEqual ≈ 10.0%
* PI/10: AttnLagDet ≈ 35.0%, AttnEqual ≈ 25.0%, LapEqual ≈ 20.0%
**HaluevalQA Chart:**
* TriviaQA: AttnLagDet ≈ 1.0%, AttnEqual ≈ 0.5%, LapEqual ≈ 0.5%
* Moopen: AttnLagDet ≈ 2.0%, AttnEqual ≈ 1.0%, LapEqual ≈ 1.0%
* HaluevalQA: AttnLagDet ≈ 45.0%, AttnEqual ≈ 30.0%, LapEqual ≈ 25.0%
* GSM8K: AttnLagDet ≈ 20.0%, AttnEqual ≈ 15.0%, LapEqual ≈ 10.0%
* SQuAD: AttnLagDet ≈ 40.0%, AttnEqual ≈ 30.0%, LapEqual ≈ 20.0%
* TruthQA: AttnLagDet ≈ 30.0%, AttnEqual ≈ 20.0%, LapEqual ≈ 15.0%
* PI/10: AttnLagDet ≈ 40.0%, AttnEqual ≈ 30.0%, LapEqual ≈ 25.0%
**CoQA Chart:**
* TriviaQA: AttnLagDet ≈ 1.0%, AttnEqual ≈ 0.5%, LapEqual ≈ 0.5%
* Moopen: AttnLagDet ≈ 2.0%, AttnEqual ≈ 1.0%, LapEqual ≈ 1.0%
* HaluevalQA: AttnLagDet ≈ 10.0%, AttnEqual ≈ 5.0%, LapEqual ≈ 5.0%
* GSM8K: AttnLagDet ≈ 15.0%, AttnEqual ≈ 10.0%, LapEqual ≈ 8.0%
* SQuAD: AttnLagDet ≈ 35.0%, AttnEqual ≈ 25.0%, LapEqual ≈ 20.0%
* TruthQA: AttnLagDet ≈ 30.0%, AttnEqual ≈ 20.0%, LapEqual ≈ 15.0%
* PI/10: AttnLagDet ≈ 40.0%, AttnEqual ≈ 30.0%, LapEqual ≈ 25.0%
### Key Observations
* Across all datasets, the AttnLagDet model generally exhibits the highest Drop (%) of AUROC, followed by AttnEqual and then LapEqual.
* The largest differences in performance between the models are observed on the SQuAD and HaluevalQA datasets.
* For TriviaQA, Moopen, and HaluevalQA, the Drop (%) of AUROC is consistently low across all models.
* The GSM8K dataset shows a moderate Drop (%) of AUROC for all models.
* The TruthQA and PI/10 datasets show a higher Drop (%) of AUROC compared to TriviaQA, Moopen, and HaluevalQA, but lower than SQuAD.
### Interpretation
The data suggests that the AttnLagDet model consistently outperforms AttnEqual and LapEqual across all tested QA datasets, as measured by the Drop (%) of AUROC. This indicates that the AttnLagDet model is more robust to changes in the input data or model parameters. The significant performance differences observed on the SQuAD and HaluevalQA datasets suggest that these datasets are more sensitive to the specific architectural choices made in the models. The consistently low Drop (%) of AUROC on TriviaQA, Moopen, and HaluevalQA may indicate that these datasets are relatively easy for the models to solve, or that the models are already performing well on these datasets. The differences in performance across datasets highlight the importance of evaluating models on a diverse set of QA tasks to ensure their generalizability. The consistent ranking of the models (AttnLagDet > AttnEqual > LapEqual) suggests a fundamental difference in their capabilities, rather than dataset-specific quirks.