\n
## Heatmap: BLEU Score and Edit Distance vs. Scenario and Temperature
### Overview
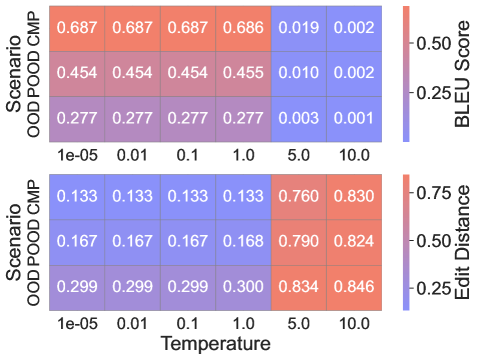
The image presents two heatmaps arranged vertically. The top heatmap displays BLEU scores, while the bottom heatmap shows Edit Distance. Both heatmaps are indexed by "Scenario" (OOD CMP, OOD POOD CMP) on the y-axis and "Temperature" (1e-05, 0.01, 0.1, 1.0, 5.0, 10.0) on the x-axis. Each cell in the heatmaps represents a value corresponding to the intersection of a specific scenario and temperature. Color intensity indicates the magnitude of the value, with corresponding colorbars on the right side of each heatmap.
### Components/Axes
* **Y-axis (Scenarios):**
* OOD CMP
* OOD POOD CMP
* **X-axis (Temperature):**
* 1e-05
* 0.01
* 0.1
* 1.0
* 5.0
* 10.0
* **Top Heatmap:** BLEU Score
* Colorbar range: 0.00 to 0.50
* Color gradient: Blue (low) to Red (high)
* **Bottom Heatmap:** Edit Distance
* Colorbar range: 0.00 to 0.75
* Color gradient: Blue (low) to Red (high)
### Detailed Analysis
**Top Heatmap (BLEU Score):**
* **Scenario: OOD CMP**
* Temperature 1e-05: 0.687
* Temperature 0.01: 0.687
* Temperature 0.1: 0.687
* Temperature 1.0: 0.686
* Temperature 5.0: 0.019
* Temperature 10.0: 0.002
* **Scenario: OOD POOD CMP**
* Temperature 1e-05: 0.454
* Temperature 0.01: 0.454
* Temperature 0.1: 0.454
* Temperature 1.0: 0.455
* Temperature 5.0: 0.010
* Temperature 10.0: 0.002
The BLEU score remains relatively constant for temperatures 1e-05, 0.01, 0.1, and 1.0 for both scenarios. A sharp decline in BLEU score is observed at temperatures 5.0 and 10.0 for both scenarios.
**Bottom Heatmap (Edit Distance):**
* **Scenario: OOD CMP**
* Temperature 1e-05: 0.133
* Temperature 0.01: 0.133
* Temperature 0.1: 0.133
* Temperature 1.0: 0.133
* Temperature 5.0: 0.760
* Temperature 10.0: 0.830
* **Scenario: OOD POOD CMP**
* Temperature 1e-05: 0.167
* Temperature 0.01: 0.167
* Temperature 0.1: 0.167
* Temperature 1.0: 0.168
* Temperature 5.0: 0.790
* Temperature 10.0: 0.824
The Edit Distance remains relatively constant for temperatures 1e-05, 0.01, 0.1, and 1.0 for both scenarios. A sharp increase in Edit Distance is observed at temperatures 5.0 and 10.0 for both scenarios.
### Key Observations
* Both BLEU score and Edit Distance exhibit a consistent pattern across scenarios and temperatures.
* Low temperatures (1e-05 to 1.0) result in relatively high BLEU scores and low Edit Distances.
* High temperatures (5.0 and 10.0) lead to significantly lower BLEU scores and higher Edit Distances.
* The OOD POOD CMP scenario consistently exhibits higher Edit Distance values than the OOD CMP scenario across all temperatures.
### Interpretation
The data suggests that increasing the temperature parameter negatively impacts the quality of the generated output, as measured by BLEU score, and increases the difference between the generated output and the reference output, as measured by Edit Distance. The sharp decline in BLEU score and increase in Edit Distance at higher temperatures indicate that the model becomes less accurate and more prone to errors when the temperature is increased.
The consistent difference in Edit Distance between the two scenarios suggests that the "OOD POOD CMP" scenario is inherently more difficult to model, resulting in larger differences between the generated and reference outputs even at low temperatures.
The temperature parameter likely controls the randomness of the model's output. Lower temperatures lead to more deterministic and predictable outputs, while higher temperatures introduce more randomness. The results indicate that a balance must be struck between randomness and accuracy to achieve optimal performance. The optimal temperature appears to be within the range of 1e-05 to 1.0, as beyond this point, the quality of the generated output deteriorates significantly.