## Diagram: Guided Generation Process with SLM
### Overview
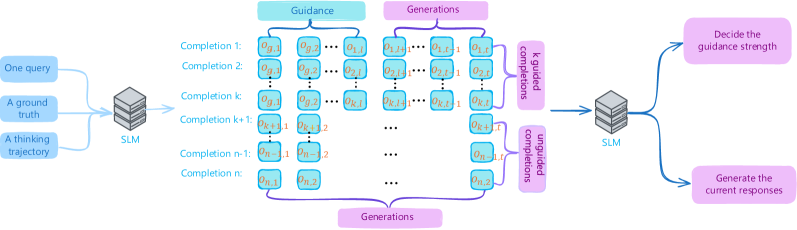
The image depicts a diagram illustrating a guided generation process utilizing a system labeled "SLM" (likely a Scaled Language Model). The process involves multiple "Completions" generated from a single query, a "ground truth," and a "thinking trajectory." These completions are then guided, resulting in "k guided completions" and "unguided completions." The diagram highlights the iterative nature of the process, with the SLM being used to decide guidance strength and generate current responses.
### Components/Axes
The diagram consists of the following key components:
* **Input:**
* "One query" (light blue arrow)
* "A ground truth" (light blue arrow)
* "A thinking trajectory" (light blue arrow)
* **SLM (Scaled Language Model):** Represented by a 3D cube. Two instances are present.
* **Completions:** Represented as rows labeled "Completion 1" through "Completion n".
* **Generations:** Represented as columns labeled "Generations".
* **Guidance:** A purple banner at the top.
* **k guided completions:** A purple banner on the right.
* **unguided completions:** A purple banner on the right.
* **Output:**
* "Decide the guidance strength" (light blue arrow)
* "Generate the current responses" (light blue arrow)
* **Data Points within Completions:** Each completion contains multiple data points labeled "O<sub>ij</sub>" and "P<sub>ij</sub>", where 'i' represents the completion number and 'j' represents the generation number.
### Detailed Analysis or Content Details
The diagram shows a matrix-like structure representing the generation process.
* **Input to SLM:** A single query, a ground truth, and a thinking trajectory are fed into the first SLM.
* **Completions:** The SLM generates 'n' completions. Each completion has multiple generations.
* **Data Points:** Within each completion (i), there are multiple generations (j). Each generation consists of two data points:
* O<sub>ij</sub>: The first data point in generation 'j' of completion 'i'.
* P<sub>ij</sub>: The second data point in generation 'j' of completion 'i'.
* **Guidance and Unguided Completions:** The diagram indicates that some completions are "k guided completions" and others are "unguided completions." The exact value of 'k' is not specified.
* **Iterative Process:** The "k guided completions" and "unguided completions" are then fed back into a second SLM, which decides the guidance strength and generates the current responses.
* **Matrix Structure:** The completions are arranged in rows (Completion 1 to Completion n), and the generations are arranged in columns. The data points O<sub>ij</sub> and P<sub>ij</sub> are positioned within this matrix.
### Key Observations
* The diagram emphasizes the iterative nature of the generation process, with feedback loops involving the SLM.
* The distinction between "guided" and "unguided" completions suggests a mechanism for controlling the generation process based on some criteria.
* The use of subscripts (ij) for the data points indicates a structured relationship between completions and generations.
* The diagram does not provide specific numerical values for the data points or the number of completions (n) or guided completions (k).
### Interpretation
This diagram illustrates a sophisticated generation process likely used in large language models. The SLM acts as a central controller, receiving input (query, ground truth, trajectory) and generating multiple completions. The "guidance" mechanism allows for steering the generation process, potentially towards more accurate or relevant outputs. The feedback loop ensures that the SLM can adapt its guidance strategy based on the results of previous generations. The "ground truth" and "thinking trajectory" suggest a reinforcement learning or similar approach where the model is trained to align its generations with desired outcomes. The diagram highlights the complexity of modern language models and the importance of controlling the generation process to achieve desired results. The use of O<sub>ij</sub> and P<sub>ij</sub> suggests that each generation produces two outputs, potentially representing different aspects of the generated text (e.g., object and predicate). The diagram is conceptual and does not provide quantitative data, but it effectively conveys the overall architecture and flow of the guided generation process.