## System Diagram: Simple Feedback Loop
### Overview
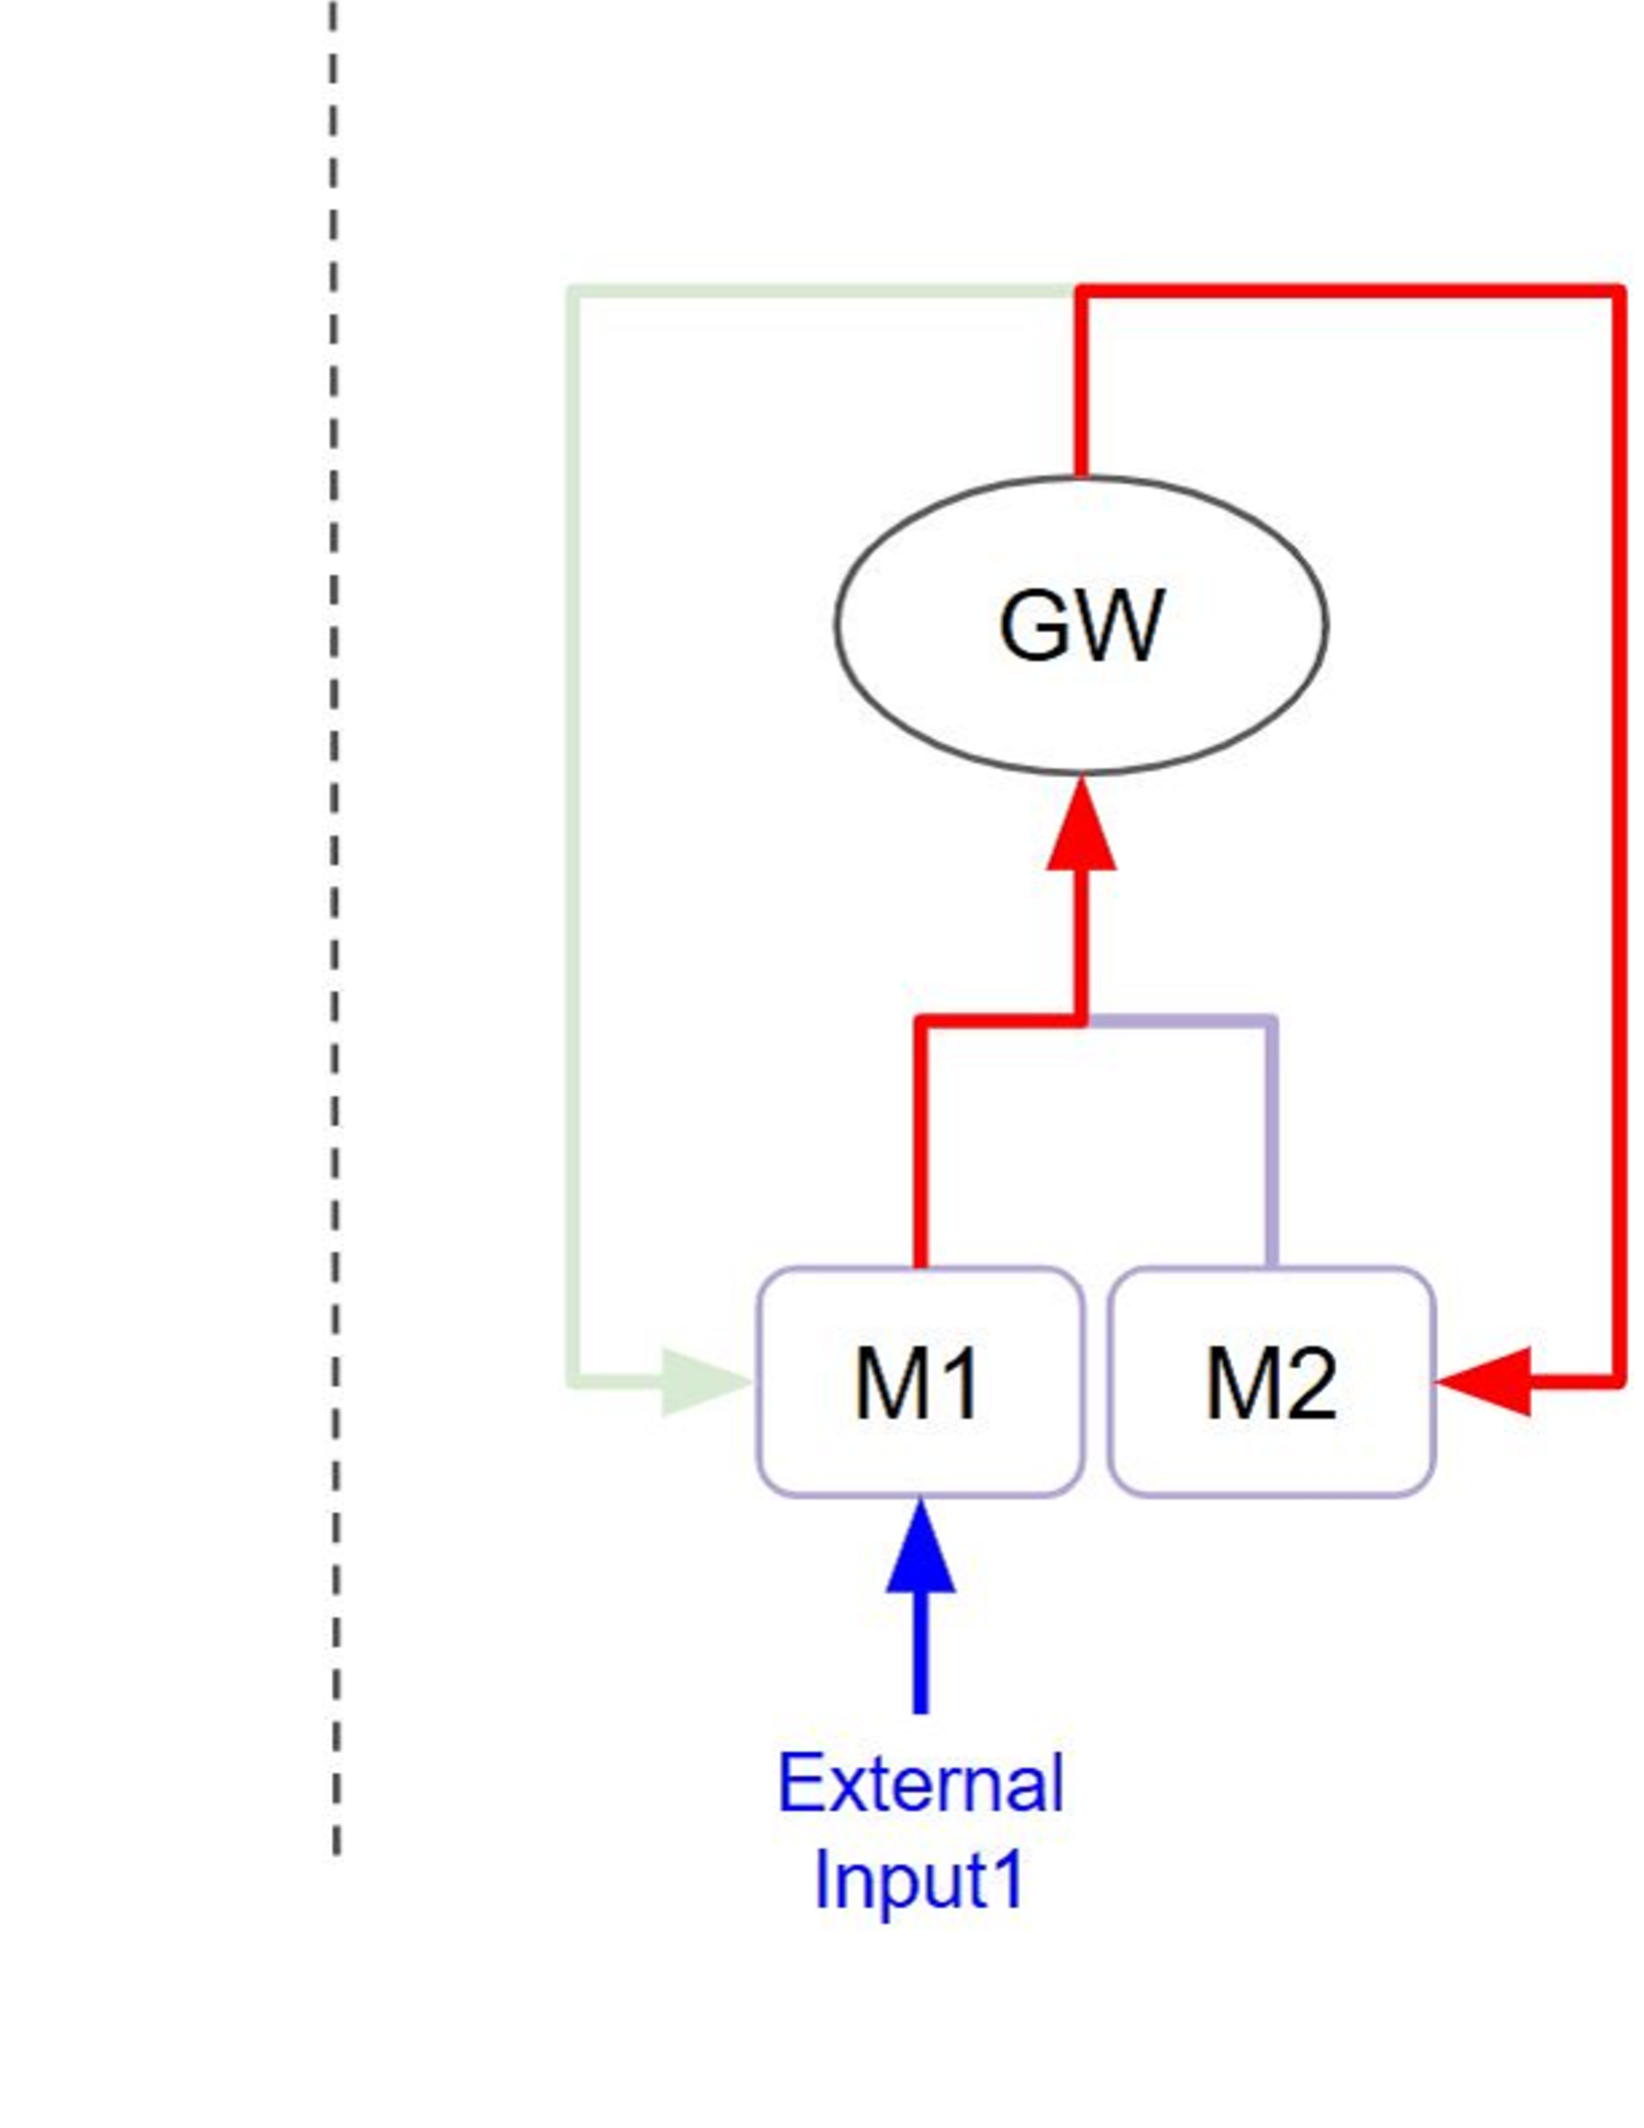
The image is a system diagram illustrating a simple feedback loop involving components labeled M1, M2, and GW. An external input feeds into M1, which then influences GW. GW, in turn, influences both M1 and M2, creating a feedback mechanism.
### Components/Axes
* **Nodes:**
* M1: A rounded rectangle labeled "M1".
* M2: A rounded rectangle labeled "M2".
* GW: An ellipse labeled "GW".
* **Input:**
* "External Input1": A blue upward-pointing arrow feeding into M1.
* **Connections/Arrows:**
* Blue arrow: Represents the external input to M1.
* Red arrows: Represent connections from M1 to GW, from M2 to GW, and from GW to M2.
* Light green arrow: Represents a connection from GW to M1.
* **Dashed Line:** A vertical dashed line on the left side of the diagram, possibly indicating a system boundary.
### Detailed Analysis or ### Content Details
1. **External Input:** The blue arrow labeled "External Input1" points directly into the M1 node.
2. **M1 to GW:** A red arrow originates from M1 and points towards GW.
3. **M2 to GW:** A light purple arrow originates from M2 and points towards GW.
4. **GW to M2:** A red arrow originates from GW and points towards M2.
5. **GW to M1:** A light green arrow originates from GW and points towards M1.
6. **Dashed Line:** A vertical dashed line is present on the left side of the diagram.
### Key Observations
* The diagram depicts a closed-loop system with feedback.
* M1 receives an external input and is influenced by GW.
* M2 is influenced by GW and also influences GW.
* The colors of the arrows indicate different types of connections or signals.
### Interpretation
The diagram represents a control system where "External Input1" affects module M1. M1 and M2 both influence "GW" (likely a global weight or some central processing unit). "GW" then feeds back into both M1 and M2, creating a feedback loop. The red arrows likely represent excitatory connections, while the light green arrow from GW to M1 might represent an inhibitory connection. The light purple arrow from M2 to GW could represent a modulatory signal. The dashed line on the left suggests that the system is part of a larger, undefined system. This type of diagram is commonly used to model biological or engineering control systems.