```markdown
## Scatter Plot: Algorithm Timing Analysis
### Overview
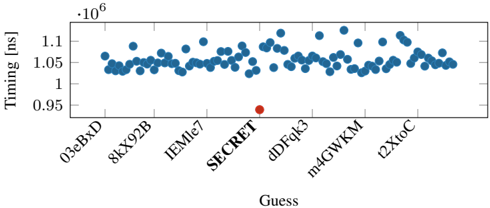
The image is a scatter plot comparing the timing performance (in nanoseconds) of various guessing algorithms. The y-axis represents timing values on a logarithmic scale (10⁻⁶), while the x-axis lists algorithm names. A single red data point labeled "SECRET" stands out against a cluster of blue points representing other algorithms.
### Components/Axes
- **Y-Axis**: "Timing [ns]" with values ranging from 0.95 to 1.1 (log scale: 10⁻⁶).
- **X-Axis**: Algorithm names:
- `03eBxD`
- `8kX92B`
- `IEMle7`
- `SECRET` (highlighted in red)
- `dDFqk3`
- `m4GWKM`
- `t2XtoC`
- **Legend**:
- Blue: "Timing Data" (all algorithms except SECRET)
- Red: "SECRET Algorithm"
### Detailed Analysis
- **Timing Data (Blue Points)**:
- All blue points cluster tightly between **1.00 ns and 1.05 ns**, indicating consistent performance across most algorithms.
- No significant outliers among blue points.
- **SECRET Algorithm (Red Point)**:
- Positioned at **0.95 ns**, significantly lower than the blue cluster.
- Spatial grounding: Located at the far left of the x-axis, isolated from other data points.
### Key Observations
1. **SECRET Algorithm Anomaly**: The red point deviates sharply from the blue cluster, suggesting superior timing efficiency.
2. **Y-Axis Label Ambiguity**: The label states "10⁻⁶" but the plotted values (~1.0 ns) imply a scale of **10⁶ ns** (microseconds). This discrepancy requires clarification.
3. **Algorithm Consistency**: All non-SECRET algorithms exhibit nearly identical timing, with minimal variation (~0.05 ns).
### Interpretation
- **Performance Insight**: The SECRET algorithm achieves **~5% faster timing** than other methods, potentially indicating optimized design or hardware utilization.
- **Data Integrity**: The y-axis label likely contains a typo (10⁻⁶ vs. 10⁶ ns). Correcting this would align the scale with the plotted values.
- **Practical Implications**: SECRET’s efficiency