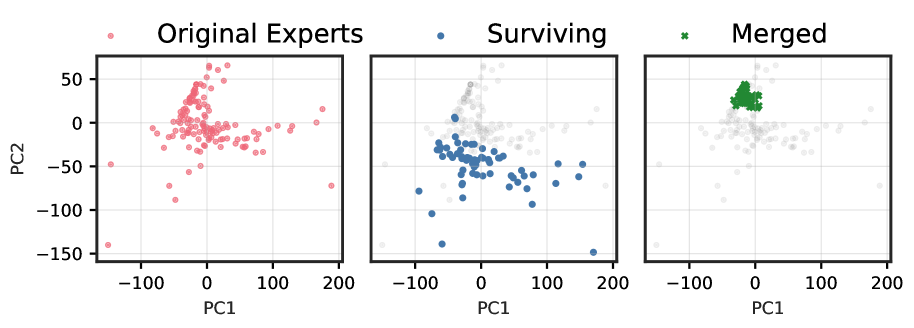
# Technical Data Extraction: Principal Component Analysis (PCA) of Expert Distribution
This document provides a detailed extraction of data from a three-panel visualization showing the evolution of "Experts" in a PCA feature space.
## 1. General Layout and Axis Information
The image consists of three side-by-side scatter plots sharing the same coordinate system.
* **X-Axis (PC1):** Ranges from approximately -150 to 200. Major tick marks are at -100, 0, 100, and 200.
* **Y-Axis (PC2):** Ranges from approximately -150 to 75. Major tick marks are at -150, -100, -50, 0, and 50.
* **Grid:** A light gray grid is present in all panels to facilitate spatial orientation.
---
## 2. Panel-by-Panel Analysis
### Panel 1: Original Experts
* **Legend Label:** Original Experts (indicated by a light red/pink circle icon).
* **Data Series Color:** Light red/pink semi-transparent circles.
* **Spatial Distribution:**
* The points represent the baseline distribution of all experts.
* The highest density is clustered around the origin (0,0).
* There is a distinct vertical "spine" extending upwards along the PC2 axis to approximately +70.
* There is a horizontal spread along the PC1 axis reaching nearly +200.
* Outliers are visible at the extreme bottom-left (approx. [-150, -140]) and far right (approx. [190, -70]).
### Panel 2: Surviving
* **Legend Label:** Surviving (indicated by a medium blue circle icon).
* **Data Series Color:** Medium blue solid circles.
* **Background Context:** The "Original Experts" from Panel 1 are shown as faint, light gray circles in the background.
* **Spatial Distribution:**
* The "Surviving" experts are primarily located in the lower-left and central regions of the original distribution.
* They occupy the space between PC1 [-100 to +150] and PC2 [-150 to +10].
* Notably, the vertical "spine" extending into positive PC2 values (seen in Panel 1) is largely absent in this group, with only one or two blue points near PC2 = 0.
### Panel 3: Merged
* **Legend Label:** Merged (indicated by a dark green 'x' icon).
* **Data Series Color:** Dark green 'x' markers.
* **Background Context:** The "Original Experts" from Panel 1 are shown as faint, light gray circles in the background.
* **Spatial Distribution:**
* The "Merged" experts are highly localized in a tight cluster.
* **Cluster Center:** Approximately PC1 = -10, PC2 = +25.
* **Cluster Range:** PC1 [-30 to +10], PC2 [+15 to +45].
* This group corresponds to the upper section of the vertical "spine" identified in the "Original Experts" panel, which was notably missing from the "Surviving" panel.
---
## 3. Summary of Trends and Relationships
By cross-referencing the three panels, the following technical conclusions can be drawn:
1. **Total Population:** The "Original Experts" represent the full set of data points.
2. **Partitioning:** The "Surviving" and "Merged" groups appear to be mutually exclusive subsets of the "Original Experts."
3. **Spatial Separation:**
* **Surviving Experts** represent the "lower" and "right-leaning" portion of the PCA space (negative PC2 and positive PC1).
* **Merged Experts** represent a specific "upper-central" cluster (positive PC2, near-zero PC1).
4. **Dimensionality:** The merging process appears to collapse a specific sub-region of the feature space (the vertical spine) into a dense, localized cluster, while the surviving experts maintain a more dispersed distribution across the remaining original space.