## Principal Component Analysis (PCA) of Expert Data
### Overview
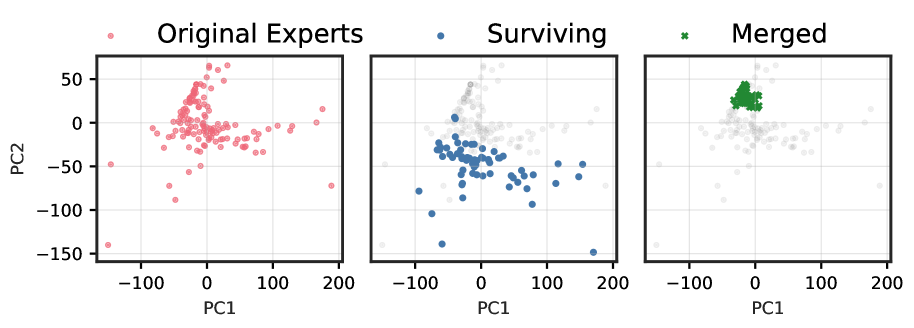
The image displays three scatter plots representing the principal component analysis (PCA) of expert data. Each plot is labeled with a different category: "Original Experts," "Surviving," and "Merged." The plots are visualized in a two-dimensional space with PC1 on the x-axis and PC2 on the y-axis.
### Components/Axes
- **X-axis (PC1)**: Represents the first principal component, which captures the most variance in the data.
- **Y-axis (PC2)**: Represents the second principal component, which captures the second most variance in the data.
- **Legend**: The legend indicates the color coding for each category: red for "Original Experts," blue for "Surviving," and green for "Merged."
- **Data Points**: Each data point represents an individual expert's data, with its position determined by its values on PC1 and PC2.
### Detailed Analysis or ### Content Details
- **Original Experts**: The red data points are scattered across the entire two-dimensional space, indicating a wide range of values on both PC1 and PC2.
- **Surviving**: The blue data points are more clustered towards the center of the plot, suggesting that these experts have more similar values on both principal components.
- **Merged**: The green data points are concentrated in a specific region of the plot, indicating a more defined and distinct cluster of experts.
### Key Observations
- **Notable Patterns**: The "Surviving" category shows a more compact distribution of data points, while the "Merged" category has a more defined and isolated cluster.
- **Outliers**: There are no significant outliers visible in any of the categories.
### Interpretation
The PCA analysis suggests that the "Original Experts" have a broader range of values on both principal components, indicating more variability in their data. The "Surviving" category shows a more centralized distribution, suggesting that these experts have more similar values and possibly more consistent data. The "Merged" category has a more defined and isolated cluster, indicating a more distinct group of experts with similar characteristics. This analysis could be used to identify patterns, outliers, and clusters within the expert data, which could be valuable for further analysis or decision-making.