## Diagram: Visual-Coordinate Mapping and Learning/Testing Pipeline
### Overview
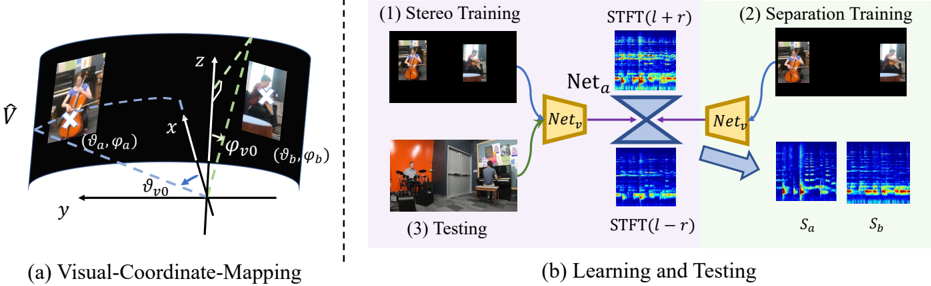
The image presents a diagram illustrating a system for audio-visual source separation. It is divided into two main parts: (a) a visual-coordinate mapping scheme and (b) a learning and testing pipeline. The left side depicts a curved visual field mapped onto a 3D coordinate system, while the right side shows a process involving stereo training, separation training, and testing using neural networks and spectrograms.
### Components/Axes
**Part (a): Visual-Coordinate Mapping**
* **Axes:** x, y, z – representing a 3D coordinate system.
* **Angles:** φ<sub>v0</sub>, φ<sub>v</sub> – angles defining the visual field.
* **Points:** (x<sub>a</sub>, y<sub>a</sub>), (x<sub>b</sub>, y<sub>b</sub>) – points on the curved visual field.
* **Vector:** A vector labeled 'v̂' pointing outwards from the origin.
* **Curved Surface:** A curved surface representing the visual field, with images of musicians displayed on it.
**Part (b): Learning and Testing**
* **Stages:** (1) Stereo Training, (2) Separation Training, (3) Testing.
* **Inputs:** Images of musicians, spectrograms labeled STFT(l + r) and STFT(l - r).
* **Networks:** Net<sub>a</sub>, Net<sub>v</sub>, Net<sub>t</sub> – neural networks used in the pipeline.
* **Outputs:** Spectrograms labeled S<sub>a</sub> and S<sub>b</sub>.
* **Arrows:** Blue arrows indicating the flow of data through the networks.
### Detailed Analysis or Content Details
**Part (a): Visual-Coordinate Mapping**
The diagram shows a curved surface representing a visual field. The x, y, and z axes define a 3D coordinate system. Two points, (x<sub>a</sub>, y<sub>a</sub>) and (x<sub>b</sub>, y<sub>b</sub>), are marked on the curved surface. The angles φ<sub>v0</sub> and φ<sub>v</sub> are defined relative to the y-axis and a vector 'v̂'. The curved surface appears to represent a wide-angle view, with images of musicians visible on it.
**Part (b): Learning and Testing**
* **(1) Stereo Training:** Two images of musicians are shown as input. These are processed to generate spectrograms STFT(l + r) and STFT(l - r). These spectrograms are then fed into two neural networks, Net<sub>a</sub> and Net<sub>v</sub>, which appear to be connected in a cross-shaped configuration.
* **(2) Separation Training:** An image of a musician is shown as input. This is processed by a neural network Net<sub>t</sub>, which outputs two spectrograms, S<sub>a</sub> and S<sub>b</sub>.
* **(3) Testing:** An image of a room with musicians is shown as input. This image is processed to generate spectrograms STFT(l + r) and STFT(l - r). These spectrograms are then fed into Net<sub>t</sub>, which presumably performs source separation.
The spectrograms are visually represented as heatmaps, with varying color intensities indicating different frequency and amplitude levels. The color scheme appears to range from dark blue (low intensity) to yellow/white (high intensity).
### Key Observations
* The system utilizes a combination of visual and auditory information for source separation.
* Neural networks play a central role in the learning and testing pipeline.
* Spectrograms are used to represent the auditory information.
* The stereo training stage appears to involve learning relationships between visual and auditory cues.
* The separation training stage aims to isolate individual sound sources.
### Interpretation
The diagram illustrates a system designed to separate audio sources based on both visual and auditory information. The visual-coordinate mapping suggests an attempt to represent the visual field in a way that facilitates the integration of visual and auditory cues. The learning and testing pipeline demonstrates how neural networks can be trained to perform source separation using stereo and monaural audio inputs. The use of spectrograms indicates that the system operates in the frequency domain.
The system likely leverages the fact that visual cues (e.g., the location of a musician) can provide information about the source of a sound. By combining visual and auditory information, the system can potentially achieve more accurate and robust source separation than systems that rely solely on auditory cues. The stereo training stage is crucial for learning the correspondence between visual and auditory information, while the separation training stage focuses on isolating individual sound sources. The testing stage demonstrates how the trained system can be used to separate sources in a real-world scenario.