\n
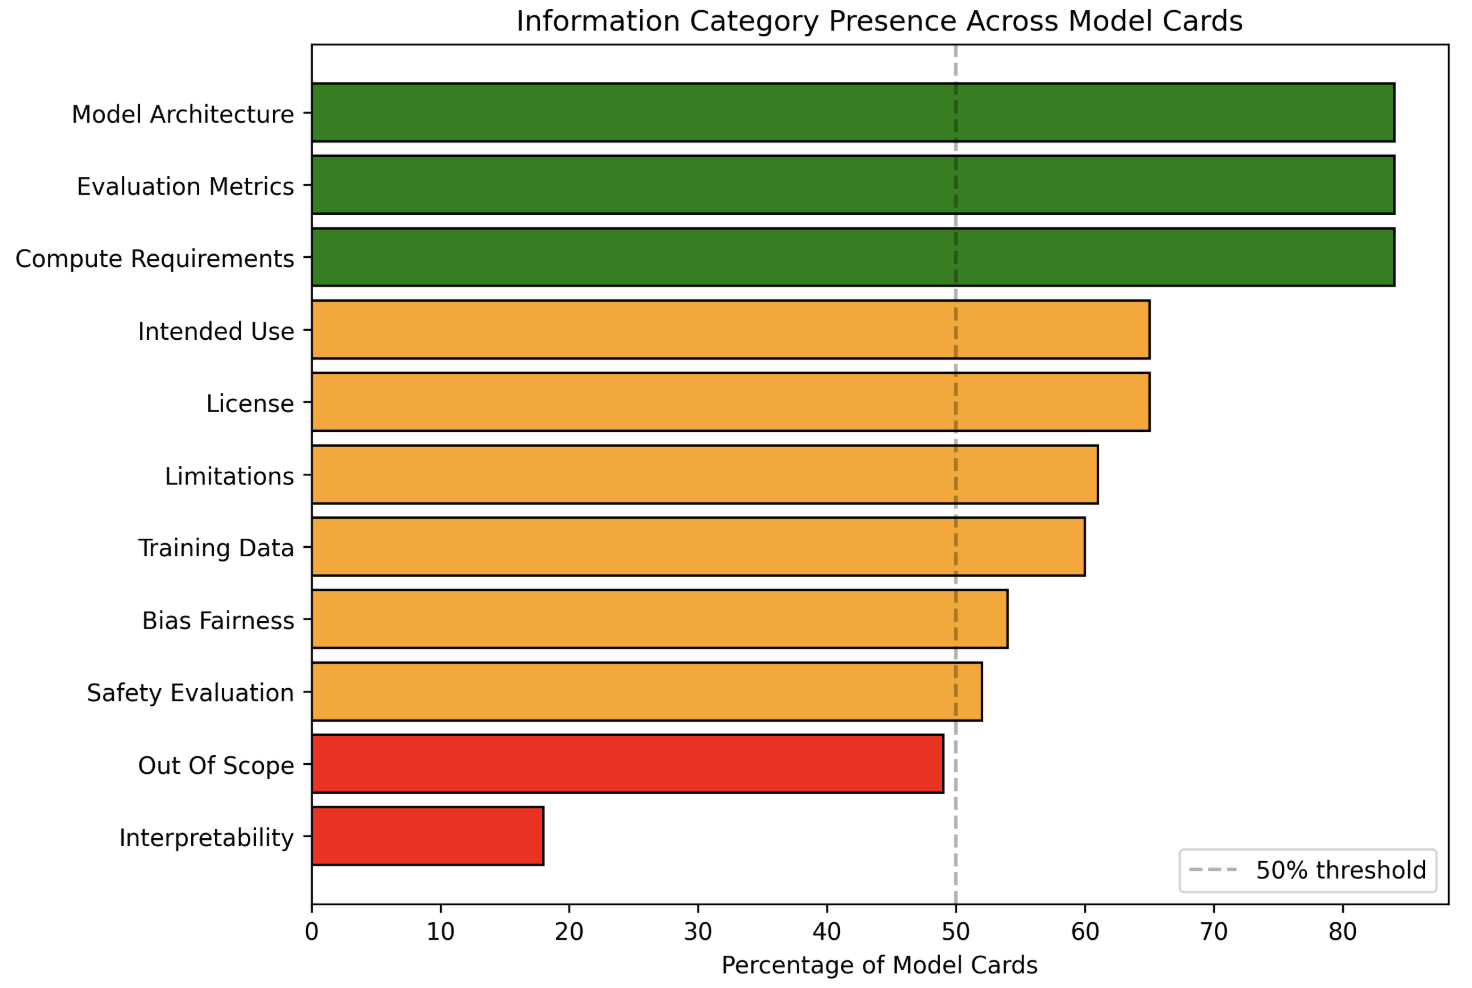
## Horizontal Bar Chart: Information Category Presence Across Model Cards
### Overview
This image is a horizontal bar chart titled "Information Category Presence Across Model Cards." It displays the percentage of model cards (documents accompanying AI models) that include specific categories of information. The chart uses color-coding to group categories relative to a 50% threshold.
### Components/Axes
* **Chart Title:** "Information Category Presence Across Model Cards" (centered at the top).
* **Y-Axis (Vertical):** Lists 11 information categories. From top to bottom:
1. Model Architecture
2. Evaluation Metrics
3. Compute Requirements
4. Intended Use
5. License
6. Limitations
7. Training Data
8. Bias Fairness
9. Safety Evaluation
10. Out Of Scope
11. Interpretability
* **X-Axis (Horizontal):** Labeled "Percentage of Model Cards." The scale runs from 0 to 80, with major tick marks at 0, 10, 20, 30, 40, 50, 60, 70, and 80.
* **Legend:** Located in the bottom-right corner. It contains a single entry: a dashed grey line labeled "50% threshold."
* **Threshold Line:** A vertical, dashed grey line extends from the x-axis at the 50% mark to the top of the chart area.
* **Color Coding:**
* **Green Bars:** Categories with presence significantly above 50%.
* **Orange Bars:** Categories with presence above 50% but lower than the green group.
* **Red Bars:** Categories with presence below 50%.
### Detailed Analysis
The chart presents the following data points, ordered from highest to lowest presence. Values are approximate based on visual alignment with the x-axis.
1. **Model Architecture (Green Bar):** ~85%
2. **Evaluation Metrics (Green Bar):** ~85%
3. **Compute Requirements (Green Bar):** ~85%
4. **Intended Use (Orange Bar):** ~65%
5. **License (Orange Bar):** ~65%
6. **Limitations (Orange Bar):** ~61%
7. **Training Data (Orange Bar):** ~60%
8. **Bias Fairness (Orange Bar):** ~54%
9. **Safety Evaluation (Orange Bar):** ~52%
10. **Out Of Scope (Red Bar):** ~49% (just below the 50% threshold line)
11. **Interpretability (Red Bar):** ~18%
**Trend Verification:** The visual trend is a clear descending order of presence. The top three technical categories form a plateau at the highest value. The middle group (orange) shows a gradual decline. The final two categories (red) drop off sharply, with "Interpretability" being a significant outlier at the low end.
### Key Observations
* **Clear Tiering:** The data is grouped into three distinct tiers based on color and value: High Presence (Green, ~85%), Moderate Presence (Orange, 52-65%), and Low Presence (Red, <50%).
* **Technical vs. Ethical/Safety Focus:** The most commonly included categories are technical (Architecture, Metrics, Compute). Ethical and safety-related categories (Bias Fairness, Safety Evaluation) are present in just over half of model cards.
* **Significant Gap in Interpretability:** "Interpretability" is the least common category by a large margin, present in less than one-fifth of model cards.
* **Threshold as a Benchmark:** The 50% dashed line serves as a clear visual benchmark. Nine of the eleven categories exceed this threshold, while two fall below it.
### Interpretation
This chart provides a quantitative snapshot of the current state of documentation practices for AI models. It reveals a strong emphasis on documenting the technical specifications and intended use of models. However, it also highlights a critical gap in the documentation of model interpretability—the ability to understand and explain a model's decisions—which is a key component for trust, debugging, and accountability.
The data suggests that while the AI community has standardized reporting on *what* a model is and *how* to run it, there is less consistent reporting on *why* it makes specific decisions or on formally evaluating its limitations and safety. The near-50% presence of "Out Of Scope" documentation indicates that many model cards do address limitations, but this is not yet universal practice. Overall, the chart underscores an opportunity to improve the comprehensiveness and transparency of model documentation, particularly in areas related to explainability and robust safety evaluation.