\n
## Diagram: Multi-Stage Agent System Workflow
### Overview
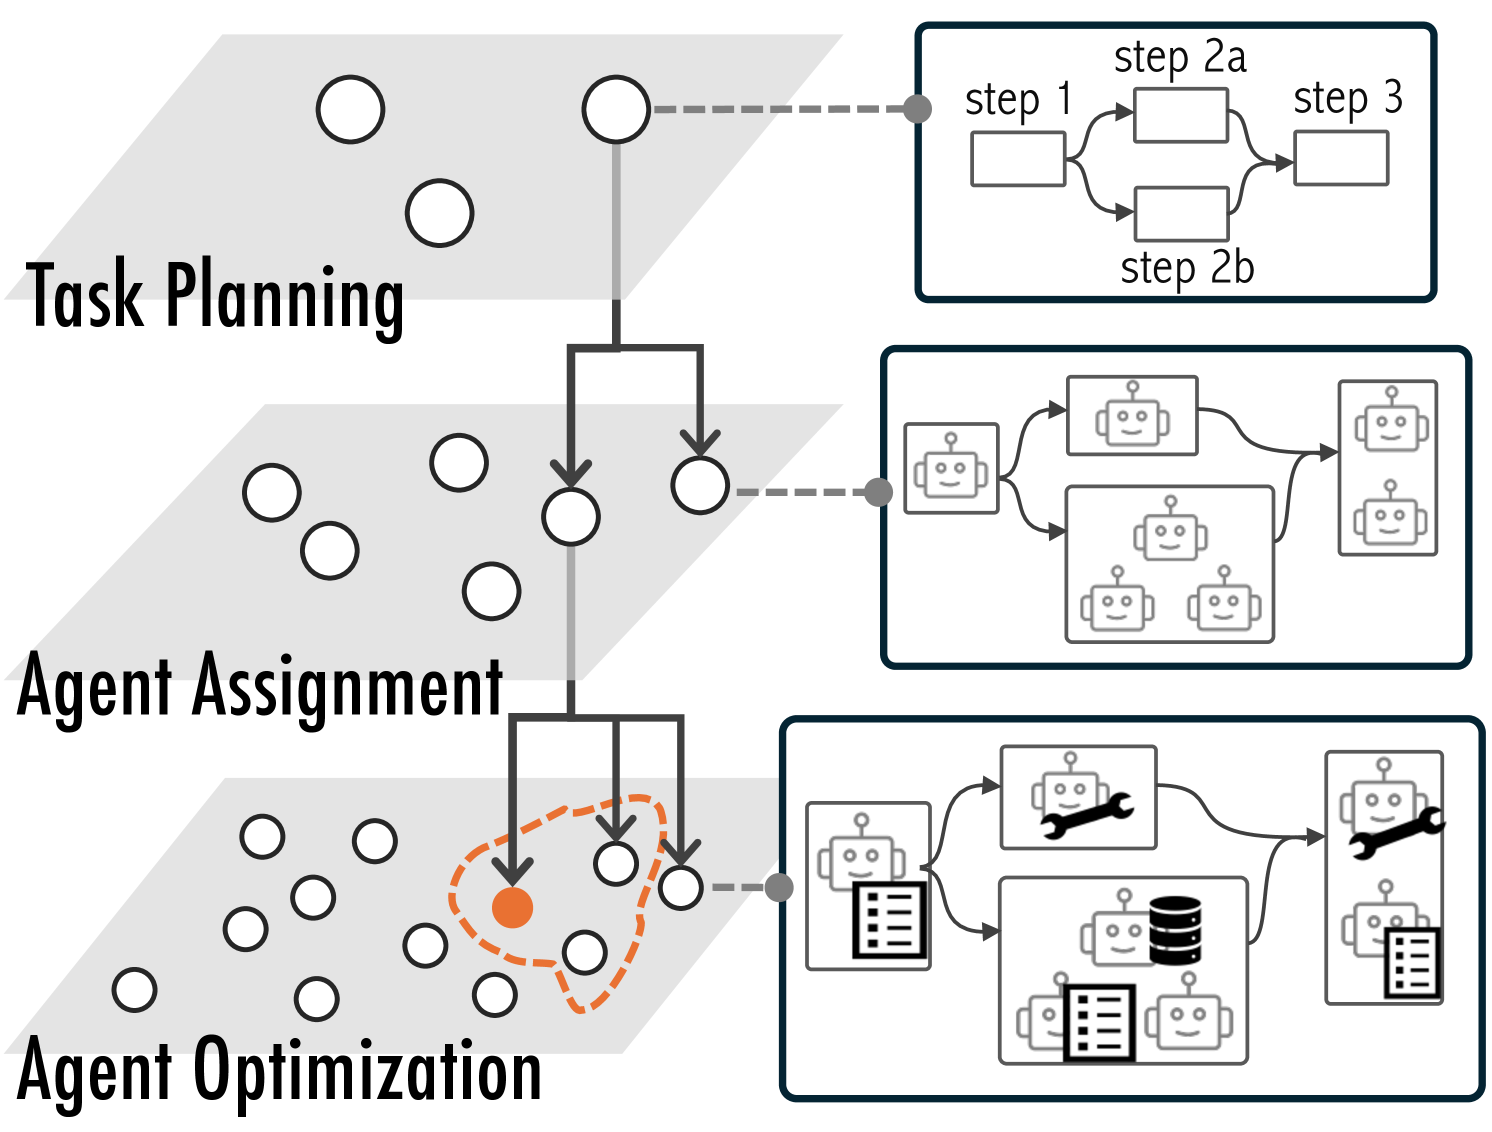
The image depicts a diagram illustrating a three-stage workflow for an agent system: Task Planning, Agent Assignment, and Agent Optimization. Each stage is represented by a shaded area with associated icons and flow arrows indicating the process. The diagram highlights the progression of tasks from initial planning to agent allocation and subsequent optimization.
### Components/Axes
The diagram is divided into three main sections, labeled from top to bottom:
1. **Task Planning:** Represented by a light gray area with several unfilled circles.
2. **Agent Assignment:** Represented by a medium gray area with several unfilled circles and a single orange-filled circle.
3. **Agent Optimization:** Represented by a dark gray area with several unfilled circles and a dashed orange circle highlighting a subset of agents.
Arrows connect the stages, indicating the flow of tasks and agents. Within each stage, there are smaller rectangular boxes containing icons representing specific steps or components.
### Detailed Analysis or Content Details
**Task Planning:**
- Contains approximately 10 unfilled circles, representing tasks.
- An arrow originates from a circle in this section and connects to the Agent Assignment stage.
- A smaller diagram to the right of this section shows a process flow:
- "step 1" is represented by a rectangle.
- "step 2a" and "step 2b" are represented by rectangles branching from "step 1".
- "step 3" is represented by a rectangle branching from "step 2a".
**Agent Assignment:**
- Contains approximately 15 unfilled circles and one orange-filled circle, representing agents.
- An arrow originates from the Task Planning stage and connects to a human icon, then to the Agent Assignment stage.
- A smaller diagram to the right of this section shows a series of four agent icons:
- Each agent icon has a smiling face.
- The icons are arranged in a 2x2 grid.
- Arrows connect the icons, suggesting interaction or communication.
**Agent Optimization:**
- Contains approximately 20 unfilled circles and a dashed orange circle encompassing a subset of agents.
- An arrow originates from the Agent Assignment stage and connects to a human icon, then to the Agent Optimization stage.
- A smaller diagram to the right of this section shows a series of four agent icons:
- Each agent icon has a wrench and a database symbol.
- The icons are arranged in a 2x2 grid.
- Arrows connect the icons, suggesting interaction or communication.
### Key Observations
- The orange-filled circle in the Agent Assignment stage and the dashed orange circle in the Agent Optimization stage highlight specific agents or a subset of agents undergoing focused attention.
- The flow arrows indicate a sequential process: tasks are planned, agents are assigned, and then agents are optimized.
- The smaller diagrams within each stage provide a more detailed view of the processes occurring within that stage.
- The icons used are consistent within each stage, suggesting a standardized workflow.
### Interpretation
The diagram illustrates a system for managing agents to perform tasks. The three stages represent a logical progression: first, tasks are planned; second, agents are assigned to those tasks; and third, the performance of those agents is optimized. The use of icons suggests that each stage involves specific tools or processes. The highlighting of certain agents suggests that the system may prioritize or focus on specific agents based on their performance or the complexity of the tasks they are assigned. The diagram implies a closed-loop system where optimization feedback informs future task planning and agent assignment. The human icons suggest human oversight or intervention at key points in the process. The diagram is a high-level overview and does not provide specific details about the algorithms or techniques used in each stage. It is a conceptual representation of a workflow rather than a detailed technical specification.