## Diagram: Prompt and Sampling Strategies
### Overview
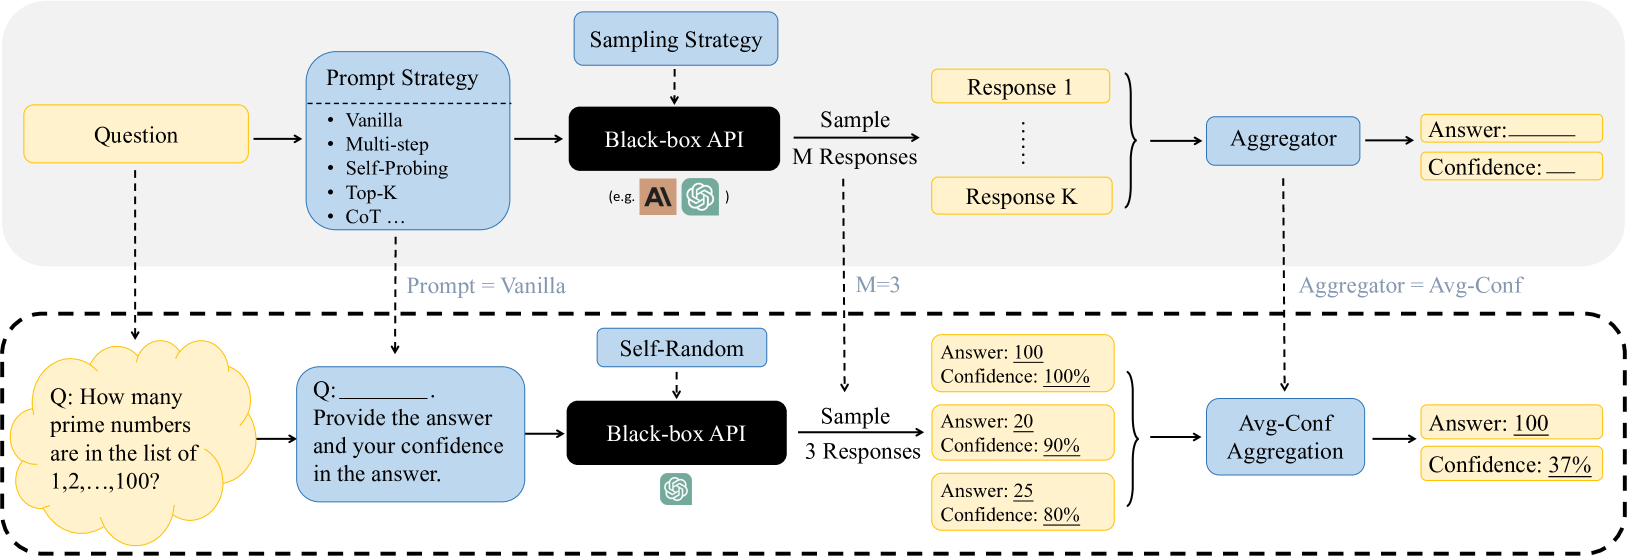
The image presents a diagram illustrating two different strategies for prompting and sampling from a "Black-box API," likely referring to a large language model (LLM). The diagram is divided into two sections, separated by a dashed line, representing two distinct approaches. The top section depicts a more general approach, while the bottom section shows a specific example with concrete values.
### Components/Axes
**Top Section (General Approach):**
* **Question:** A yellow rectangle labeled "Question" represents the initial input to the system.
* **Prompt Strategy:** A blue rectangle labeled "Prompt Strategy" lists several prompting techniques:
* Vanilla
* Multi-step
* Self-Probing
* Top-K
* CoT (Chain of Thought)
* **Black-box API:** A black rectangle labeled "Black-box API" represents the LLM being used. It includes logos of AI models, including the 'AI' logo and the OpenAI logo.
* **Sampling Strategy:** The phrase "Sampling Strategy" is above the Black-box API box.
* **M Responses:** The system samples "M Responses" from the API.
* **Response 1 ... Response K:** Yellow rectangles representing individual responses from the API.
* **Aggregator:** A blue rectangle labeled "Aggregator" combines the multiple responses.
* **Answer:** A yellow rectangle labeled "Answer" shows the final answer.
* **Confidence:** A yellow rectangle labeled "Confidence" shows the confidence level associated with the answer.
**Bottom Section (Specific Example):**
* **Question:** A yellow cloud shape contains the question: "Q: How many prime numbers are in the list of 1,2,...,100?"
* **Prompt:** A blue rectangle contains the prompt: "Q: \_\_\_\_ Provide the answer and your confidence in the answer."
* **Black-box API:** A black rectangle labeled "Black-box API" represents the LLM. It includes the OpenAI logo.
* **Self-Random:** A blue rectangle labeled "Self-Random" is above the Black-box API box.
* **3 Responses:** The system samples "3 Responses" from the API.
* **Responses:** Three yellow rectangles show the individual responses:
* "Answer: 100; Confidence: 100%"
* "Answer: 20; Confidence: 90%"
* "Answer: 25; Confidence: 80%"
* **Avg-Conf Aggregation:** A blue rectangle labeled "Avg-Conf Aggregation" combines the responses.
* **Answer:** A yellow rectangle labeled "Answer: 100" shows the final answer.
* **Confidence:** A yellow rectangle labeled "Confidence: 37%" shows the confidence level associated with the answer.
### Detailed Analysis or ### Content Details
**Flow:**
* In the top section, the "Question" is fed into the "Prompt Strategy," which then interacts with the "Black-box API" to generate "M Responses." These responses are aggregated to produce a final "Answer" and "Confidence" score.
* In the bottom section, a specific question about prime numbers is used. The prompt asks for both the answer and the confidence level. The "Black-box API" generates 3 responses, which are then aggregated using "Avg-Conf Aggregation" to produce a final answer and confidence score.
**Values:**
* In the bottom section, the individual responses have the following values:
* Response 1: Answer = 100, Confidence = 100%
* Response 2: Answer = 20, Confidence = 90%
* Response 3: Answer = 25, Confidence = 80%
* The final aggregated result in the bottom section is:
* Answer = 100
* Confidence = 37%
### Key Observations
* The diagram highlights two different approaches to interacting with an LLM: a general approach with configurable prompting and sampling strategies, and a specific example with a concrete question and a fixed number of responses.
* The aggregation method in the bottom section ("Avg-Conf Aggregation") appears to be averaging the confidence scores of the individual responses. (100% + 90% + 80%) / 3 = 90%. However, the final confidence is 37%, which suggests that the aggregation method is more complex than a simple average.
* The final answer in the bottom section is 100, which matches one of the individual responses.
### Interpretation
The diagram illustrates how different prompting and sampling strategies can be used to interact with LLMs. The specific example in the bottom section demonstrates that even when individual responses have high confidence levels, the aggregated result may have a significantly lower confidence level. This suggests that averaging confidence scores may not be a reliable way to assess the overall confidence in the final answer. The discrepancy between the individual confidence scores and the final confidence score highlights the challenges of working with LLMs and the need for more sophisticated aggregation methods. The diagram also suggests that the choice of prompt and sampling strategy can significantly impact the quality and reliability of the results.