TECHNICAL ASSET FINGERPRINT
77037586ab097ce8e7bd4b36
Click to view fullscreen
Press ESC or click to close
FOUND IN PAPERS
EXPERT: gemini-2.0-flash VERSION 1
RUNTIME: nugit/gemini/gemini-2.0-flash
INTEL_VERIFIED
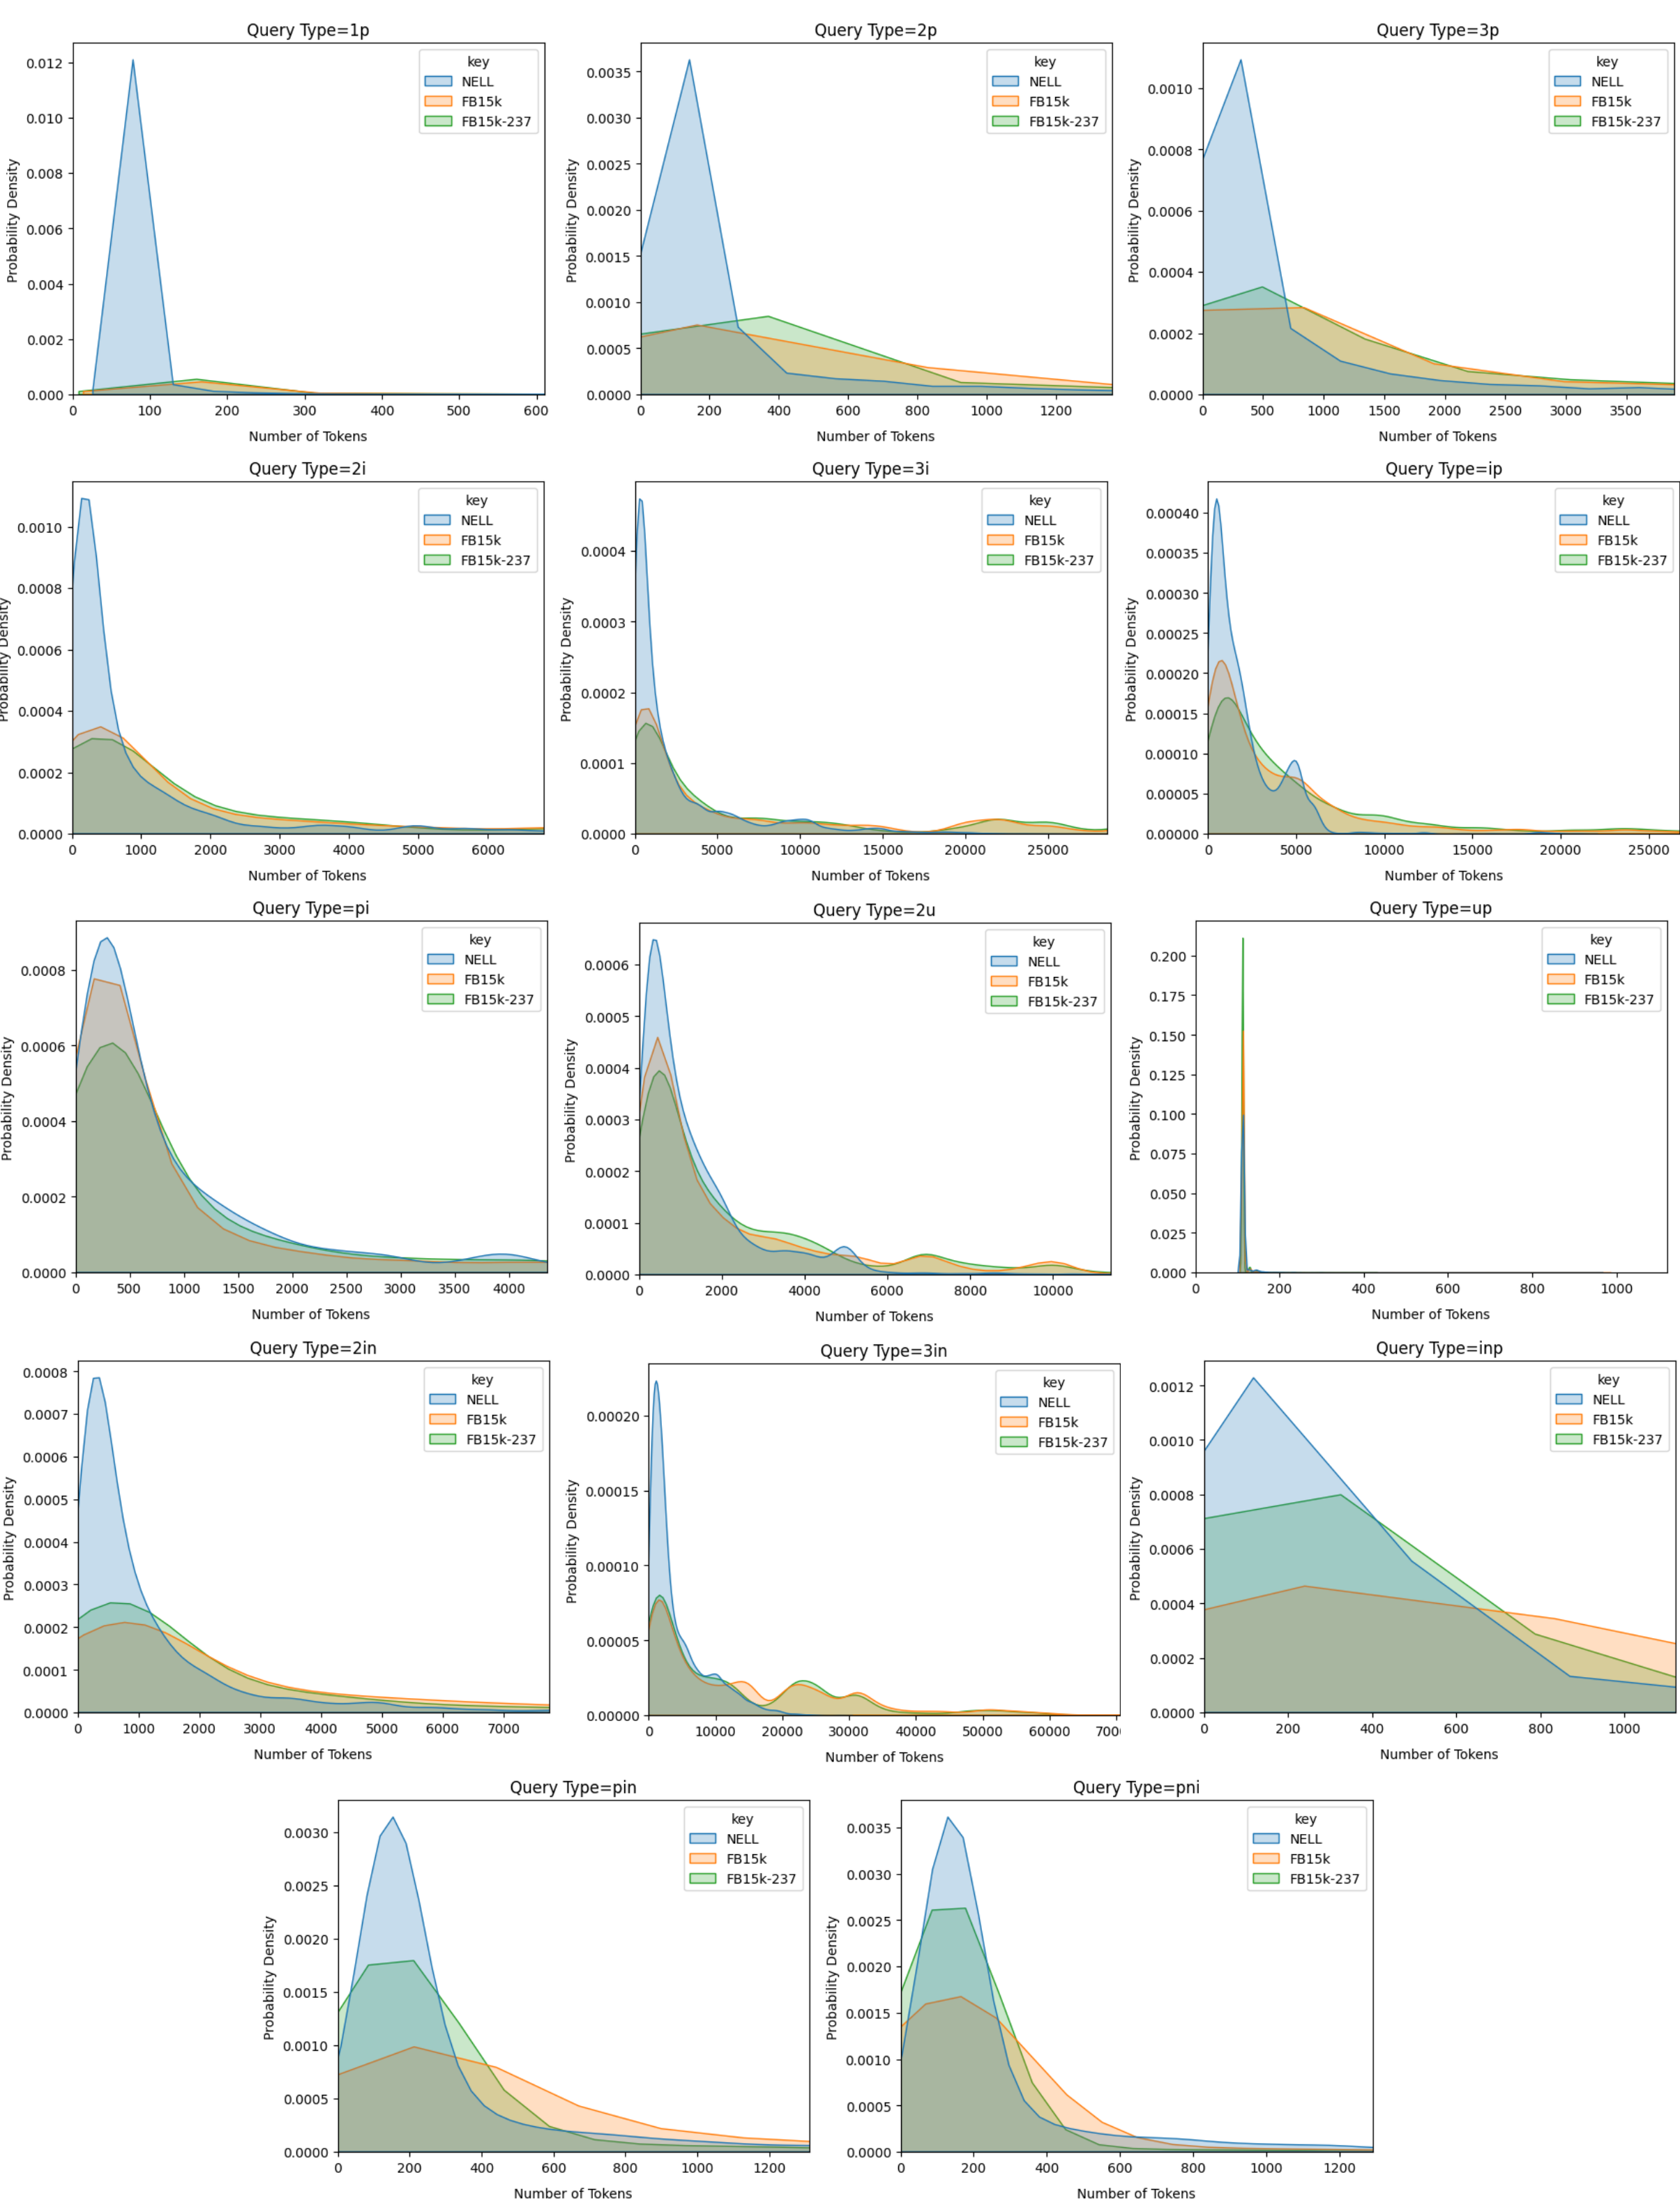
## Chart Type: Probability Density Plots of Token Counts for Different Query Types
### Overview
The image presents a grid of 12 probability density plots. Each plot visualizes the distribution of the number of tokens for a specific query type across three datasets: NELL, FB15k, and FB15k-237. The x-axis represents the number of tokens, and the y-axis represents the probability density.
### Components/Axes
* **Title:** Each plot has a title indicating the "Query Type" (e.g., "Query Type=1p", "Query Type=2p", etc.).
* **X-axis:** Labeled "Number of Tokens". The scale varies across plots, ranging from 0 to different maximum values (e.g., 600, 1200, 3500, 25000, 10000).
* **Y-axis:** Labeled "Probability Density". The scale varies across plots, ranging from 0 to different maximum values (e.g., 0.012, 0.0035, 0.0010, 0.0004).
* **Legend (Key):** Located in the top-right corner of each plot. It identifies the three datasets:
* NELL (Blue)
* FB15k (Orange)
* FB15k-237 (Green)
### Detailed Analysis
**Plot 1: Query Type=1p**
* X-axis: 0 to 600 tokens
* Y-axis: 0 to 0.012 probability density
* NELL (Blue): Shows a sharp peak around 100 tokens, then rapidly decreases.
* FB15k (Orange): Low probability density, peaking around 200 tokens.
* FB15k-237 (Green): Low probability density, peaking around 200 tokens, similar to FB15k.
**Plot 2: Query Type=2p**
* X-axis: 0 to 1200 tokens
* Y-axis: 0 to 0.0035 probability density
* NELL (Blue): Peak around 200 tokens, then decreases.
* FB15k (Orange): Peak around 600 tokens.
* FB15k-237 (Green): Peak around 400 tokens.
**Plot 3: Query Type=3p**
* X-axis: 0 to 3500 tokens
* Y-axis: 0 to 0.0010 probability density
* NELL (Blue): Peak around 500 tokens, then decreases.
* FB15k (Orange): Peak around 1000 tokens.
* FB15k-237 (Green): Peak around 800 tokens.
**Plot 4: Query Type=2i**
* X-axis: 0 to 6000 tokens
* Y-axis: 0 to 0.0010 probability density
* NELL (Blue): Peak near 0 tokens, then decreases.
* FB15k (Orange): Peak around 1000 tokens.
* FB15k-237 (Green): Peak around 500 tokens.
**Plot 5: Query Type=3i**
* X-axis: 0 to 25000 tokens
* Y-axis: 0 to 0.0004 probability density
* NELL (Blue): Peak near 0 tokens, then decreases.
* FB15k (Orange): Peak around 5000 tokens.
* FB15k-237 (Green): Peak around 2500 tokens.
**Plot 6: Query Type=ip**
* X-axis: 0 to 25000 tokens
* Y-axis: 0 to 0.0004 probability density
* NELL (Blue): Peak near 0 tokens, then decreases.
* FB15k (Orange): Peak around 5000 tokens.
* FB15k-237 (Green): Peak around 2500 tokens.
**Plot 7: Query Type=pi**
* X-axis: 0 to 4000 tokens
* Y-axis: 0 to 0.0008 probability density
* NELL (Blue): Peak around 200 tokens, then decreases.
* FB15k (Orange): Peak around 500 tokens.
* FB15k-237 (Green): Peak around 400 tokens.
**Plot 8: Query Type=2u**
* X-axis: 0 to 10000 tokens
* Y-axis: 0 to 0.0006 probability density
* NELL (Blue): Peak near 0 tokens, then decreases.
* FB15k (Orange): Peak around 1000 tokens.
* FB15k-237 (Green): Peak around 500 tokens.
**Plot 9: Query Type=up**
* X-axis: 0 to 1000 tokens
* Y-axis: 0 to 0.200 probability density
* NELL (Blue): Peak near 0 tokens, then decreases.
* FB15k (Orange): Peak near 0 tokens, then decreases.
* FB15k-237 (Green): Peak near 0 tokens, then decreases.
**Plot 10: Query Type=2in**
* X-axis: 0 to 7000 tokens
* Y-axis: 0 to 0.0008 probability density
* NELL (Blue): Peak near 0 tokens, then decreases.
* FB15k (Orange): Peak around 1000 tokens.
* FB15k-237 (Green): Peak around 500 tokens.
**Plot 11: Query Type=3in**
* X-axis: 0 to 70000 tokens
* Y-axis: 0 to 0.00020 probability density
* NELL (Blue): Peak near 0 tokens, then decreases.
* FB15k (Orange): Peak around 10000 tokens.
* FB15k-237 (Green): Peak around 5000 tokens.
**Plot 12: Query Type=inp**
* X-axis: 0 to 1000 tokens
* Y-axis: 0 to 0.0012 probability density
* NELL (Blue): Peak around 200 tokens, then decreases.
* FB15k (Orange): Peak around 200 tokens.
* FB15k-237 (Green): Peak around 100 tokens.
### Key Observations
* The distribution of token counts varies significantly depending on the query type.
* NELL tends to have lower token counts compared to FB15k and FB15k-237.
* FB15k and FB15k-237 often have similar distributions, but FB15k tends to have slightly higher token counts.
* Some query types (e.g., "up") have very low token counts across all datasets.
* The x-axis scales vary widely, indicating that some query types involve much larger numbers of tokens than others.
### Interpretation
The plots illustrate the probability density of the number of tokens for different query types across three knowledge graph datasets. The data suggests that the complexity and structure of queries, as defined by their type, significantly influence the number of tokens required to represent them. The differences between the datasets (NELL, FB15k, FB15k-237) indicate variations in how these knowledge graphs are structured and queried. NELL generally uses fewer tokens, possibly indicating a simpler or more concise query structure compared to FB15k and FB15k-237. The specific query types (1p, 2p, 3p, etc.) likely correspond to different types of relationships or patterns being queried within the knowledge graphs. The plots can be used to understand the characteristics of different query types and how they relate to the structure of the underlying knowledge graphs. The "up" query type is a notable outlier, suggesting a very simple query structure with minimal token usage.
DECODING INTELLIGENCE...
EXPERT: nemotron-free VERSION 1
RUNTIME: free/nvidia/nemotron-nano-12b-v2-vl:free
INTEL_VERIFIED
## Line Graphs: Probability Density Distributions Across Query Types and Models
### Overview
The image displays 14 line graphs arranged in a grid, each representing the probability density distribution of token counts for different query types (e.g., `1p`, `2p`, `3p`, `ip`, `pi`, `up`, `in`, `inp`, `pin`, `2i`, `3i`, `2u`, `3u`). Three models are compared: `key` (blue), `NELL` (orange), and `FB15k-237` (green). Each graph shows how token counts are probabilistically distributed for a specific query type across these models.
---
### Components/Axes
- **X-Axis**: "Number of Tokens" (ranges vary per graph, e.g., 0–600 for `1p`, 0–1200 for `2p`, up to 10,000 for `2u`).
- **Y-Axis**: "Probability Density" (consistent scale: 0.0000 to 0.0012).
- **Legend**: Located in the top-right corner of each graph, with labels:
- `key` (blue)
- `NELL` (orange)
- `FB15k-237` (green)
- **Graph Titles**: Positioned at the top of each subplot, labeled with query types (e.g., `Query Type=1p`, `Query Type=2p`).
---
### Detailed Analysis
#### Query Type `1p`
- **Key (blue)**: Sharp peak at ~100 tokens (probability density ~0.0012).
- **NELL (orange)**: Broader distribution, peaking at ~150 tokens (density ~0.0008).
- **FB15k-237 (green)**: Flattest distribution, peaking at ~200 tokens (density ~0.0005).
#### Query Type `2p`
- **Key (blue)**: Peak at ~200 tokens (density ~0.0035).
- **NELL (orange)**: Broader peak at ~300 tokens (density ~0.0025).
- **FB15k-237 (green)**: Gradual decline from ~400 tokens (density ~0.0015).
#### Query Type `3p`
- **Key (blue)**: Peak at ~500 tokens (density ~0.0010).
- **NELL (orange)**: Broader peak at ~700 tokens (density ~0.0008).
- **FB15k-237 (green)**: Flattest distribution, peaking at ~1,000 tokens (density ~0.0005).
#### Query Type `ip`
- **Key (blue)**: Sharp peak at ~200 tokens (density ~0.0004).
- **NELL (orange)**: Broader peak at ~300 tokens (density ~0.0002).
- **FB15k-237 (green)**: Flattest distribution, peaking at ~500 tokens (density ~0.0001).
#### Query Type `pi`
- **Key (blue)**: Sharp peak at ~1,000 tokens (density ~0.0008).
- **NELL (orange)**: Broader peak at ~1,500 tokens (density ~0.0005).
- **FB15k-237 (green)**: Flattest distribution, peaking at ~2,000 tokens (density ~0.0003).
#### Query Type `up`
- **Key (blue)**: Single sharp peak at ~200 tokens (density ~0.20).
- **NELL (orange)**: Minimal presence, negligible density.
- **FB15k-237 (green)**: Minimal presence, negligible density.
#### Query Type `in`
- **Key (blue)**: Sharp peak at ~1,000 tokens (density ~0.0020).
- **NELL (orange)**: Broader peak at ~2,000 tokens (density ~0.0010).
- **FB15k-237 (green)**: Flattest distribution, peaking at ~3,000 tokens (density ~0.0005).
#### Query Type `inp`
- **Key (blue)**: Sharp peak at ~500 tokens (density ~0.0012).
- **NELL (orange)**: Broader peak at ~800 tokens (density ~0.0008).
- **FB15k-237 (green)**: Flattest distribution, peaking at ~1,200 tokens (density ~0.0005).
#### Query Type `pin`
- **Key (blue)**: Sharp peak at ~300 tokens (density ~0.0030).
- **NELL (orange)**: Broader peak at ~500 tokens (density ~0.0020).
- **FB15k-237 (green)**: Flattest distribution, peaking at ~700 tokens (density ~0.0010).
#### Query Type `pi` (Repeated)
- Same as earlier `pi` analysis.
#### Query Type `2i`
- **Key (blue)**: Sharp peak at ~1,000 tokens (density ~0.0008).
- **NELL (orange)**: Broader peak at ~2,000 tokens (density ~0.0005).
- **FB15k-237 (green)**: Flattest distribution, peaking at ~3,000 tokens (density ~0.0003).
#### Query Type `3i`
- **Key (blue)**: Sharp peak at ~5,000 tokens (density ~0.0004).
- **NELL (orange)**: Broader peak at ~7,000 tokens (density ~0.0003).
- **FB15k-237 (green)**: Flattest distribution, peaking at ~9,000 tokens (density ~0.0002).
#### Query Type `2u`
- **Key (blue)**: Sharp peak at ~5,000 tokens (density ~0.0006).
- **NELL (orange)**: Broader peak at ~7,000 tokens (density ~0.0004).
- **FB15k-237 (green)**: Flattest distribution, peaking at ~9,000 tokens (density ~0.0002).
#### Query Type `3u`
- **Key (blue)**: Sharp peak at ~10,000 tokens (density ~0.0003).
- **NELL (orange)**: Broader peak at ~12,000 tokens (density ~0.0002).
- **FB15k-237 (green)**: Flattest distribution, peaking at ~14,000 tokens (density ~0.0001).
---
### Key Observations
1. **Model Differences**:
- `key` consistently shows sharp, narrow peaks, indicating precise token usage.
- `NELL` exhibits broader distributions, suggesting variability in token requirements.
- `FB15k-237` has the flattest distributions, implying uniform token usage across ranges.
2. **Query Type Trends**:
- Complex query types (e.g., `3p`, `2u`, `3u`) require higher token counts.
- Simpler query types (e.g., `1p`, `up`) cluster around lower token counts.
3. **Anomalies**:
- The `up` query type (`Query Type=up`) has an extreme outlier: `key` dominates with a single sharp peak, while `NELL` and `FB15k-237` are negligible.
---
### Interpretation
The data suggests that:
- The `key` model is optimized for specific token counts, likely due to its precision in handling structured queries.
- `NELL` and `FB15k-237` models exhibit trade-offs between flexibility and uniformity, with `NELL` being more variable and `FB15k-237` more consistent.
- Query types with higher token counts (e.g., `3p`, `2u`) may involve more complex or ambiguous tasks, requiring models to explore wider token ranges.
- The `up` query type’s dominance by `key` highlights its unique suitability for this specific task, possibly due to its simplicity or structured nature.
This analysis underscores the importance of model selection based on query complexity and token efficiency requirements.
DECODING INTELLIGENCE...