## Chart: % Negative Objects vs Epochs
### Overview
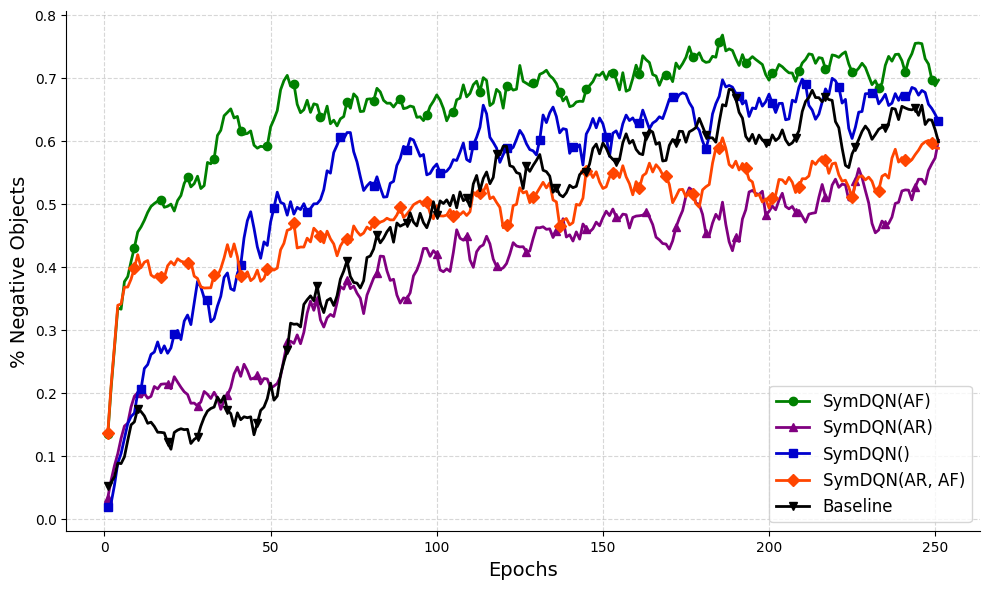
The image is a line chart comparing the percentage of negative objects over epochs for different SymDQN configurations and a baseline. The x-axis represents epochs, ranging from 0 to 250. The y-axis represents the percentage of negative objects, ranging from 0.0 to 0.8. There are five data series represented by different colored lines: SymDQN(AF) (green), SymDQN(AR) (purple), SymDQN() (blue), SymDQN(AR, AF) (orange), and Baseline (black).
### Components/Axes
* **X-axis:** Epochs, ranging from 0 to 250 in increments of 50.
* **Y-axis:** % Negative Objects, ranging from 0.0 to 0.8 in increments of 0.1.
* **Legend:** Located in the bottom-right corner, identifying each line by color and label:
* Green: SymDQN(AF)
* Purple: SymDQN(AR)
* Blue: SymDQN()
* Orange: SymDQN(AR, AF)
* Black: Baseline
### Detailed Analysis
* **SymDQN(AF) (Green):** The green line representing SymDQN(AF) starts at approximately 0.45 at epoch 0, rapidly increases to approximately 0.65 by epoch 50, and then fluctuates between 0.6 and 0.75 for the remainder of the epochs.
* Epoch 0: ~0.45
* Epoch 50: ~0.65
* Epoch 250: ~0.70
* **SymDQN(AR) (Purple):** The purple line representing SymDQN(AR) starts at approximately 0.15 at epoch 0, gradually increases to approximately 0.4 by epoch 150, and then fluctuates between 0.35 and 0.55 for the remainder of the epochs.
* Epoch 0: ~0.15
* Epoch 50: ~0.20
* Epoch 150: ~0.40
* Epoch 250: ~0.60
* **SymDQN() (Blue):** The blue line representing SymDQN() starts at approximately 0.05 at epoch 0, rapidly increases to approximately 0.5 by epoch 50, and then fluctuates between 0.4 and 0.7 for the remainder of the epochs.
* Epoch 0: ~0.05
* Epoch 50: ~0.50
* Epoch 250: ~0.65
* **SymDQN(AR, AF) (Orange):** The orange line representing SymDQN(AR, AF) starts at approximately 0.15 at epoch 0, rapidly increases to approximately 0.45 by epoch 50, and then fluctuates between 0.35 and 0.6 for the remainder of the epochs.
* Epoch 0: ~0.15
* Epoch 50: ~0.45
* Epoch 250: ~0.60
* **Baseline (Black):** The black line representing the baseline starts at approximately 0.05 at epoch 0, gradually increases to approximately 0.45 by epoch 150, and then fluctuates between 0.4 and 0.65 for the remainder of the epochs.
* Epoch 0: ~0.05
* Epoch 50: ~0.20
* Epoch 150: ~0.45
* Epoch 250: ~0.65
### Key Observations
* SymDQN(AF) consistently has the highest percentage of negative objects throughout the epochs.
* SymDQN(AR) generally has the lowest percentage of negative objects.
* The Baseline and SymDQN() configurations perform similarly, with SymDQN() showing slightly higher values.
* All configurations show an initial increase in the percentage of negative objects, followed by fluctuations.
### Interpretation
The chart suggests that the SymDQN(AF) configuration is the most effective at identifying negative objects, as it consistently maintains the highest percentage. The SymDQN(AR) configuration appears to be the least effective. The other configurations fall in between, with the baseline performing comparably to SymDQN(). The initial increase in negative objects likely reflects the learning phase of the models, while the subsequent fluctuations may indicate ongoing adjustments and potential overfitting. The differences in performance between the configurations highlight the impact of different SymDQN parameters on the model's ability to identify negative objects.