## Scatter Plot: Timing vs. Guess
### Overview
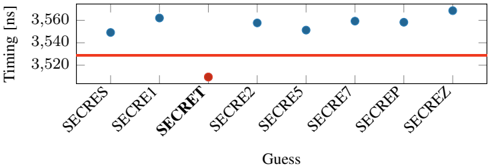
The image is a scatter plot showing the timing (in nanoseconds) for different "guesses." The x-axis represents the guesses, and the y-axis represents the timing. A horizontal red line is present at approximately 3528 ns. Most guesses have a timing around 3550 ns, except for one guess labeled "SECRET" which has a significantly lower timing.
### Components/Axes
* **X-axis:** "Guess" with categories: SECRES, SECRE1, SECRET, SECRE2, SECRE5, SECRE7, SECREP, SECREZ.
* **Y-axis:** "Timing [ns]" with scale from 3520 to 3560 ns. Axis markers are present at 3520, 3540, and 3560 ns.
* **Horizontal Line:** A red horizontal line is present at approximately 3528 ns.
### Detailed Analysis
* **SECRES:** Timing is approximately 3546 ns (blue dot).
* **SECRE1:** Timing is approximately 3559 ns (blue dot).
* **SECRET:** Timing is approximately 3512 ns (red dot).
* **SECRE2:** Timing is approximately 3557 ns (blue dot).
* **SECRE5:** Timing is approximately 3551 ns (blue dot).
* **SECRE7:** Timing is approximately 3557 ns (blue dot).
* **SECREP:** Timing is approximately 3558 ns (blue dot).
* **SECREZ:** Timing is approximately 3559 ns (blue dot).
### Key Observations
* The timing for the "SECRET" guess is significantly lower than all other guesses.
* All other guesses have timings clustered between 3546 ns and 3559 ns.
* The red horizontal line is positioned at approximately 3528 ns.
### Interpretation
The scatter plot suggests that the "SECRET" guess results in a significantly faster timing compared to the other guesses. This could indicate that the "SECRET" guess is the correct one, or that it triggers a different code path that executes more quickly. The red line could represent a threshold or a target timing value. The fact that the "SECRET" guess falls below this line while all other guesses are above it further emphasizes its distinct behavior.