## Line Chart: Timing Analysis Across SECRE Variants
### Overview
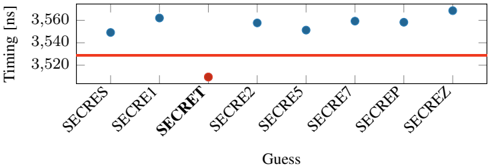
The image displays a line chart comparing timing measurements (in nanoseconds) across eight variants labeled SECRES, SECRE1, SECRET, SECRE2, SECRE5, SECRE7, SECREP, and SECREZ. A red horizontal reference line at 3,520 ns spans the chart, while blue data points represent measured timing values for each variant.
### Components/Axes
- **X-Axis (Guess)**: Categorical labels for SECRE variants (SECRES, SECRE1, SECRET, SECRE2, SECRE5, SECRE7, SECREP, SECREZ), positioned at the bottom.
- **Y-Axis (Timing [ns])**: Numerical scale from 3,500 to 3,580 ns, with gridlines at 10 ns intervals.
- **Legend**: No explicit legend present. The red line is a reference threshold, not tied to a legend.
- **Data Points**: Blue dots represent measured timing values for each SECRE variant.
### Detailed Analysis
- **SECRES**: ~3,540 ns (blue dot above red line).
- **SECRE1**: ~3,560 ns (blue dot above red line).
- **SECRET**: ~3,510 ns (blue dot below red line, outlier).
- **SECRE2**: ~3,550 ns (blue dot above red line).
- **SECRE5**: ~3,540 ns (blue dot above red line).
- **SECRE7**: ~3,550 ns (blue dot above red line).
- **SECREP**: ~3,550 ns (blue dot above red line).
- **SECREZ**: ~3,570 ns (blue dot above red line, highest value).
### Key Observations
1. **Threshold Deviation**: The red line at 3,520 ns acts as a performance benchmark. All variants except SECRET exceed this threshold.
2. **Outlier**: SECRET (3,510 ns) is the only variant below the reference line, indicating underperformance.
3. **Highest Value**: SECREZ (3,570 ns) shows the longest timing, deviating significantly from the cluster of values (~3,540–3,560 ns).
4. **Clustering**: Most variants cluster tightly between 3,540 and 3,560 ns, suggesting consistency in performance for these cases.
### Interpretation
The chart suggests a comparative analysis of timing efficiency across SECRE variants, with the red line (3,520 ns) serving as a target or acceptable limit. SECRET’s sub-threshold performance (3,510 ns) may indicate an optimization or anomaly, while SECREZ’s elevated timing (3,570 ns) could signal inefficiency or resource contention. The tight clustering of most variants implies minimal variability in their timing, except for SECREZ. The absence of a legend clarifies that the red line is purely a reference, not tied to a specific data series. This data could inform decisions about variant selection, debugging, or process optimization in a technical system.