## Line Graphs: Qwen3-8B and Qwen3-32B Performance
### Overview
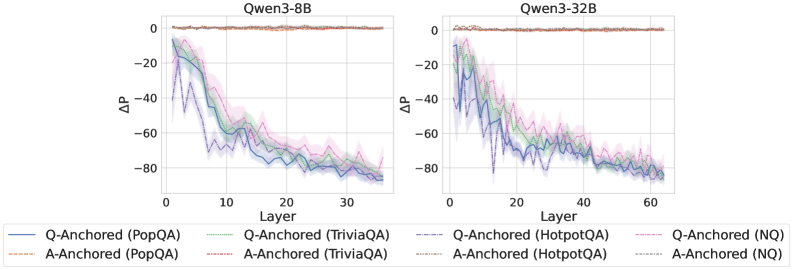
The image contains two line graphs comparing the performance of Qwen3-8B and Qwen3-32B models across different layers and question-answering datasets. The y-axis represents ΔP (Delta P), and the x-axis represents the layer number. Each graph plots the performance of question-anchored (Q-Anchored) and answer-anchored (A-Anchored) versions of the models on four datasets: PopQA, TriviaQA, HotpotQA, and NQ.
### Components/Axes
**Left Graph (Qwen3-8B):**
* **Title:** Qwen3-8B
* **X-axis:** Layer, with ticks at 0, 10, 20, and 30. The x-axis ranges from 0 to approximately 35.
* **Y-axis:** ΔP, with ticks at 0, -20, -40, -60, and -80. The y-axis ranges from 0 to -80.
* **Legend (bottom):**
* Blue solid line: Q-Anchored (PopQA)
* Brown dashed line: A-Anchored (PopQA)
* Green dotted line: Q-Anchored (TriviaQA)
* Light green dash-dotted line: A-Anchored (TriviaQA)
* Purple dash-dotted line: Q-Anchored (NQ)
* Pink dashed line: A-Anchored (NQ)
* Dark Green dash-dotted line: Q-Anchored (HotpotQA)
* Grey dotted line: A-Anchored (HotpotQA)
**Right Graph (Qwen3-32B):**
* **Title:** Qwen3-32B
* **X-axis:** Layer, with ticks at 0, 20, 40, and 60. The x-axis ranges from 0 to approximately 65.
* **Y-axis:** ΔP, with ticks at 0, -20, -40, -60, and -80. The y-axis ranges from 0 to -80.
* **Legend (bottom):**
* Blue solid line: Q-Anchored (PopQA)
* Brown dashed line: A-Anchored (PopQA)
* Green dotted line: Q-Anchored (TriviaQA)
* Light green dash-dotted line: A-Anchored (TriviaQA)
* Purple dash-dotted line: Q-Anchored (NQ)
* Pink dashed line: A-Anchored (NQ)
* Dark Green dash-dotted line: Q-Anchored (HotpotQA)
* Grey dotted line: A-Anchored (HotpotQA)
### Detailed Analysis
**Qwen3-8B:**
* **Q-Anchored (PopQA) (Blue solid line):** Starts at approximately -15, decreases rapidly to around -70 by layer 10, and then plateaus around -75 to -80.
* **A-Anchored (PopQA) (Brown dashed line):** Remains relatively constant around 0.
* **Q-Anchored (TriviaQA) (Green dotted line):** Starts at approximately -10, decreases to around -55 by layer 10, and then plateaus around -60 to -70.
* **A-Anchored (TriviaQA) (Light green dash-dotted line):** Starts at approximately -15, decreases to around -50 by layer 10, and then plateaus around -60 to -70.
* **Q-Anchored (NQ) (Purple dash-dotted line):** Starts at approximately -15, decreases rapidly to around -70 by layer 10, and then plateaus around -75 to -80.
* **A-Anchored (NQ) (Pink dashed line):** Starts at approximately -15, decreases to around -50 by layer 10, and then plateaus around -60 to -70.
* **Q-Anchored (HotpotQA) (Dark Green dash-dotted line):** Starts at approximately -10, decreases to around -55 by layer 10, and then plateaus around -60 to -70.
* **A-Anchored (HotpotQA) (Grey dotted line):** Starts at approximately -15, decreases to around -50 by layer 10, and then plateaus around -60 to -70.
**Qwen3-32B:**
* **Q-Anchored (PopQA) (Blue solid line):** Starts at approximately -15, decreases rapidly to around -70 by layer 20, and then plateaus around -75 to -80.
* **A-Anchored (PopQA) (Brown dashed line):** Remains relatively constant around 0.
* **Q-Anchored (TriviaQA) (Green dotted line):** Starts at approximately -10, decreases to around -55 by layer 20, and then plateaus around -60 to -70.
* **A-Anchored (TriviaQA) (Light green dash-dotted line):** Starts at approximately -15, decreases to around -50 by layer 20, and then plateaus around -60 to -70.
* **Q-Anchored (NQ) (Purple dash-dotted line):** Starts at approximately -15, decreases rapidly to around -70 by layer 20, and then plateaus around -75 to -80.
* **A-Anchored (NQ) (Pink dashed line):** Starts at approximately -15, decreases to around -50 by layer 20, and then plateaus around -60 to -70.
* **Q-Anchored (HotpotQA) (Dark Green dash-dotted line):** Starts at approximately -10, decreases to around -55 by layer 20, and then plateaus around -60 to -70.
* **A-Anchored (HotpotQA) (Grey dotted line):** Starts at approximately -15, decreases to around -50 by layer 20, and then plateaus around -60 to -70.
### Key Observations
* The A-Anchored (PopQA) performance remains consistently near 0 across all layers for both models.
* The Q-Anchored lines generally show a rapid decrease in ΔP in the initial layers, followed by a plateau.
* The Qwen3-32B model shows a similar trend to Qwen3-8B, but the decrease in ΔP occurs over a larger number of layers.
* The performance on PopQA and NQ datasets (Q-Anchored) appears to be slightly worse (lower ΔP) than on TriviaQA and HotpotQA.
### Interpretation
The graphs illustrate the performance of Qwen3-8B and Qwen3-32B models on different question-answering datasets, with a focus on how the performance changes across different layers of the model. The A-Anchored (PopQA) consistently performing near 0 suggests that the answer anchoring strategy is not effective for the PopQA dataset. The rapid decrease in ΔP for Q-Anchored lines indicates that the model's performance improves significantly in the initial layers, but the improvement plateaus as the model goes deeper. The Qwen3-32B model, with its larger size, shows a similar trend but over a larger number of layers, suggesting that it takes more layers for the model to reach its optimal performance. The difference in performance between datasets suggests that the model is better suited for some types of questions than others.