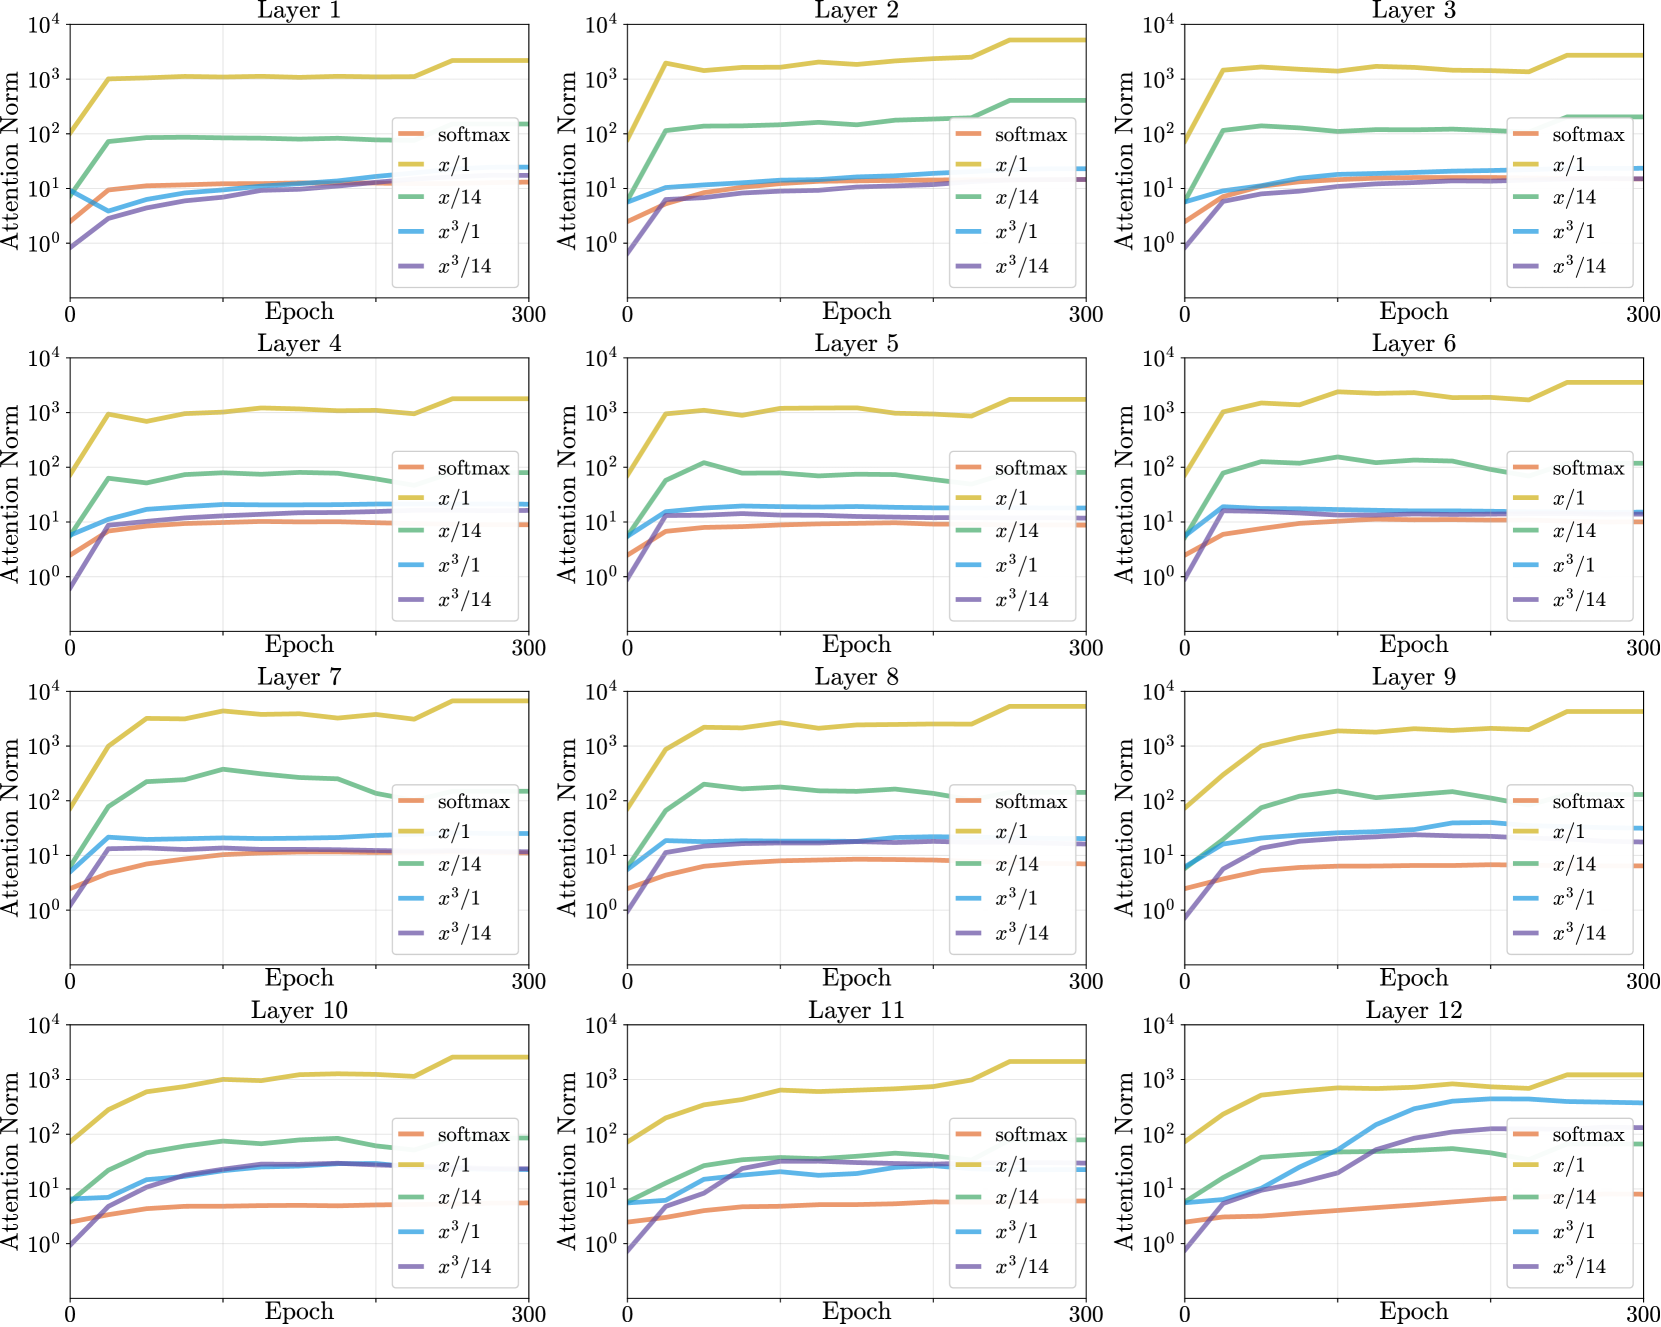
## Line Graphs: Attention Norm Trends Across 12 Layers
### Overview
The image contains 12 line graphs arranged in a 4x3 grid, each representing attention norm dynamics across 300 training epochs for different neural network layers (Layer 1 to Layer 12). All graphs share identical axes and legend configurations, with logarithmic y-axis scaling (10⁰ to 10⁴) and linear x-axis progression (0-300 epochs). Each graph tracks five attention norm trajectories corresponding to different scaling methods.
### Components/Axes
- **X-axis**: Epoch (0-300), linear scale
- **Y-axis**: Attention Norm (10⁰ to 10⁴), logarithmic scale
- **Legend**: Positioned right-aligned in each subplot, containing:
- softmax (orange)
- x/1 (yellow)
- x/14 (green)
- x³/1 (blue)
- x³/14 (purple)
- **Graph Structure**: All subplots share identical formatting with gridlines and axis labels
### Detailed Analysis
1. **Layer 1-3**:
- x³/14 (purple) shows gradual ascent from ~10⁰ to ~10²
- x³/1 (blue) demonstrates sharper initial growth (~10⁰→10²) then plateaus
- softmax (orange) remains relatively flat (~10⁰→10¹)
- x/1 (yellow) exhibits moderate growth (~10⁰→10²)
- x/14 (green) shows slow linear progression (~10⁰→10¹)
2. **Layer 4-6**:
- x³/14 maintains consistent ~10¹-10² range
- x³/1 shows ~10¹-10².5 range with minor fluctuations
- softmax remains stable at ~10⁰-10¹
- x/1 demonstrates ~10¹-10².5 range
- x/14 shows ~10⁰-10¹ range with slight oscillations
3. **Layer 7-9**:
- x³/14 exhibits ~10¹-10².5 range with minor fluctuations
- x³/1 shows ~10¹-10².5 range with increased volatility
- softmax remains stable at ~10⁰-10¹
- x/1 demonstrates ~10¹-10².5 range with minor oscillations
- x/14 shows ~10⁰-10¹ range with slight upward trend
4. **Layer 10-12**:
- x³/14 demonstrates significant growth (~10¹→10³ in Layer 12)
- x³/1 shows ~10¹-10³ range with pronounced upward trend
- softmax remains stable at ~10⁰-10¹
- x/1 demonstrates ~10¹-10³ range with gradual ascent
- x/14 shows ~10⁰-10² range with moderate growth
### Key Observations
1. **Scaling Method Impact**:
- x³/14 consistently shows strongest growth across all layers
- softmax demonstrates most stable behavior across layers
- x³/1 shows increasing volatility in deeper layers
- x/14 maintains moderate growth with layer depth
2. **Layer Depth Correlation**:
- Deeper layers (10-12) show more pronounced attention norm growth
- x³/14 scaling exhibits exponential growth in later layers
- x³/1 demonstrates increasing instability in deeper layers
- softmax remains consistently stable regardless of layer depth
3. **Temporal Dynamics**:
- All methods show initial growth phase (0-100 epochs)
- x³/14 demonstrates sustained growth beyond 200 epochs
- x³/1 shows plateauing behavior after initial growth
- softmax maintains stable baseline throughout training
### Interpretation
The data suggests that different attention scaling methods produce distinct layer-specific dynamics:
1. **x³/14 Scaling**: Most effective for deep layer attention modulation, showing exponential growth particularly in later layers (10-12). This suggests potential for enhanced feature discrimination in deeper network regions.
2. **x³/1 Scaling**: Demonstrates strong initial growth but increasing instability in deeper layers, possibly indicating over-saturation of attention mechanisms.
3. **softmax**: Provides most stable attention distribution across all layers, suggesting reliable but potentially limited expressive capacity.
4. **x/14 Scaling**: Shows moderate growth with layer depth, maintaining balance between stability and adaptability.
Notable anomalies include the dramatic x³/14 growth in Layer 12 (~10¹→10³), which may indicate either optimal scaling for deep attention mechanisms or potential overfitting risks. The consistent softmax stability across layers suggests it might be optimal for maintaining balanced attention distribution but could limit model capacity in deeper layers.