## Scatter Plot: Accuracy vs. Time-to-Answer
### Overview
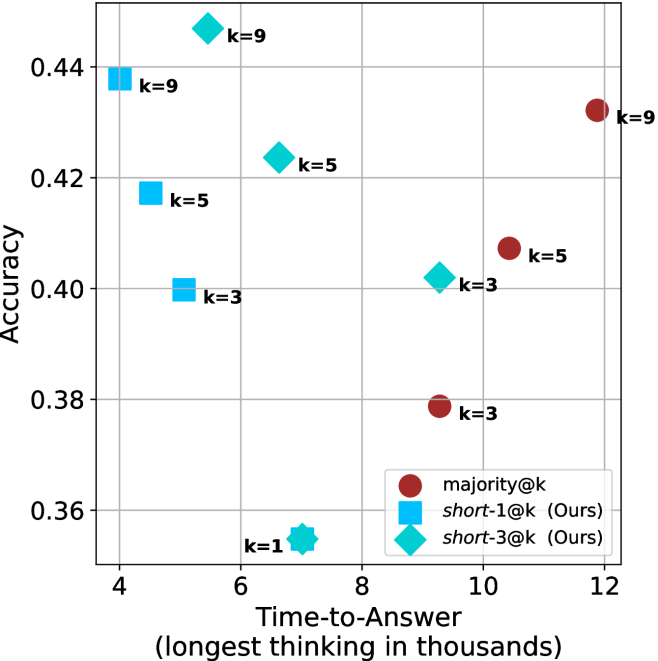
This scatter plot compares the performance of three different methods—`majority@k`, `short-1@k` (Ours), and `short-3@k` (Ours)—across varying values of `k` (1, 3, 5, and 9). The chart evaluates the trade-off between "Time-to-Answer" (x-axis) and "Accuracy" (y-axis).
### Components/Axes
* **X-Axis**: "Time-to-Answer (longest thinking in thousands)". The scale ranges from 4 to 12, with major grid lines at intervals of 2.
* **Y-Axis**: "Accuracy". The scale ranges from 0.36 to 0.44, with major grid lines at intervals of 0.02.
* **Legend (Bottom-Right)**:
* **Dark Red Circle**: `majority@k`
* **Cyan Square**: `short-1@k (Ours)`
* **Cyan Diamond**: `short-3@k (Ours)`
* **Data Markers**: Each point is labeled with its corresponding `k` value (e.g., "k=9", "k=5", etc.).
### Detailed Analysis
#### 1. `short-1@k (Ours)` (Cyan Squares)
* **Trend**: As `k` increases from 1 to 9, the time-to-answer decreases (moving left), while accuracy increases (moving up).
* **Data Points**:
* **k=9**: x ≈ 4.2, y ≈ 0.438
* **k=5**: x ≈ 4.8, y ≈ 0.418
* **k=3**: x ≈ 5.2, y ≈ 0.400
* **k=1**: x ≈ 7.0, y ≈ 0.355 (Shared marker with `short-3@k`)
#### 2. `short-3@k (Ours)` (Cyan Diamonds)
* **Trend**: Similar to `short-1@k`, as `k` increases, the time-to-answer decreases while accuracy increases. This series generally occupies the upper-left quadrant of the chart, indicating high efficiency.
* **Data Points**:
* **k=9**: x ≈ 5.5, y ≈ 0.448 (Highest accuracy point on the chart)
* **k=5**: x ≈ 6.8, y ≈ 0.424
* **k=3**: x ≈ 9.4, y ≈ 0.402
* **k=1**: x ≈ 7.0, y ≈ 0.355 (Shared marker with `short-1@k`)
#### 3. `majority@k` (Dark Red Circles)
* **Trend**: This series shows a positive correlation between time and accuracy (as time increases, accuracy increases), but it is significantly slower than the "Ours" methods.
* **Data Points**:
* **k=9**: x ≈ 11.9, y ≈ 0.433
* **k=5**: x ≈ 10.5, y ≈ 0.407
* **k=3**: x ≈ 9.4, y ≈ 0.379
### Key Observations
* **Efficiency Gap**: The "Ours" methods (`short-1@k` and `short-3@k`) are significantly more efficient than `majority@k`. They achieve higher or comparable accuracy in roughly half the time (x-values ranging from ~4 to ~7 vs. ~9 to ~12).
* **Performance Peak**: The `short-3@k` method at `k=9` achieves the highest accuracy on the chart (~0.448) while maintaining a relatively low time-to-answer (~5.5).
* **Convergence**: At `k=1`, both `short-1@k` and `short-3@k` converge to the exact same performance point (x ≈ 7.0, y ≈ 0.355).
* **Outlier Behavior**: The `majority@k` series is the only one that follows a traditional "more time = more accuracy" slope, whereas the "Ours" methods appear to invert this relationship, where higher `k` values actually result in lower time-to-answer.
### Interpretation
The data demonstrates that the "Ours" methods (`short-1@k` and `short-3@k`) are Pareto-optimal compared to the `majority@k` baseline.
The most striking finding is the inverse relationship between `k` and time-to-answer for the "Ours" methods: increasing `k` (which usually implies more computation) actually *reduces* the time-to-answer in this specific context. This suggests that the "Ours" methods likely employ an early-exit or pruning strategy where higher `k` values allow the model to find the correct answer faster, rather than simply doing more work. Conversely, `majority@k` behaves as a standard ensemble method, where increasing `k` requires more time to process more candidates, leading to higher latency.