## Scatter Plot: Accuracy vs. Time-to-Answer
### Overview
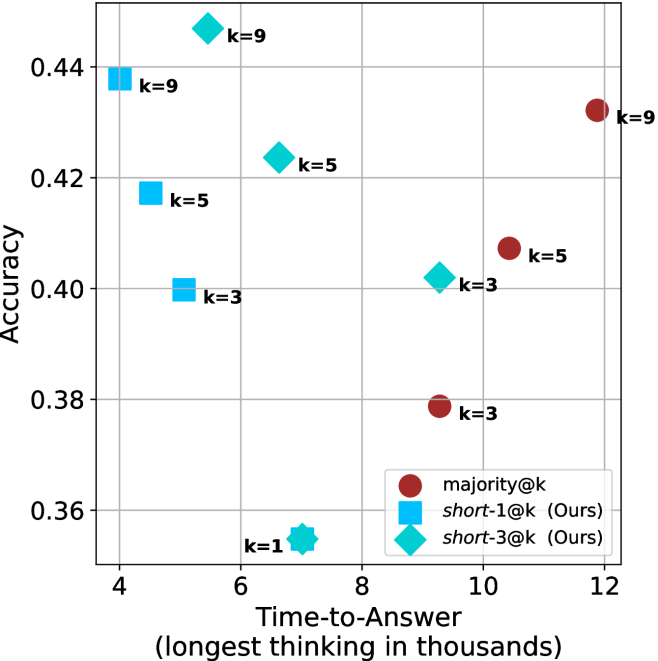
The image is a scatter plot comparing the accuracy of different methods (majority@k, short-1@k, and short-3@k) against the time-to-answer. The x-axis represents the time-to-answer in thousands, and the y-axis represents the accuracy. Each data point is labeled with a 'k' value, indicating a parameter associated with the method.
### Components/Axes
* **X-axis:** Time-to-Answer (longest thinking in thousands). Scale ranges from 4 to 12.
* **Y-axis:** Accuracy. Scale ranges from 0.36 to 0.44.
* **Legend (bottom-right):**
* Red circle: majority@k
* Blue square: short-1@k (Ours)
* Teal diamond: short-3@k (Ours)
* **Data Points:** Each point is labeled with its corresponding 'k' value.
### Detailed Analysis
**1. majority@k (Red Circles):**
* Trend: Accuracy increases with time-to-answer.
* k=3: Time-to-Answer ≈ 9, Accuracy ≈ 0.38
* k=5: Time-to-Answer ≈ 10, Accuracy ≈ 0.41
* k=9: Time-to-Answer ≈ 12, Accuracy ≈ 0.43
**2. short-1@k (Ours) (Blue Squares):**
* Trend: Accuracy increases with time-to-answer.
* k=3: Time-to-Answer ≈ 5, Accuracy ≈ 0.40
* k=5: Time-to-Answer ≈ 4.5, Accuracy ≈ 0.42
* k=9: Time-to-Answer ≈ 4, Accuracy ≈ 0.44
**3. short-3@k (Ours) (Teal Diamonds):**
* Trend: Accuracy increases with time-to-answer.
* k=1: Time-to-Answer ≈ 7, Accuracy ≈ 0.355
* k=3: Time-to-Answer ≈ 9, Accuracy ≈ 0.40
* k=5: Time-to-Answer ≈ 6.5, Accuracy ≈ 0.425
* k=9: Time-to-Answer ≈ 5.5, Accuracy ≈ 0.45
### Key Observations
* For the 'majority@k' method, increasing 'k' and time-to-answer results in higher accuracy.
* The 'short-1@k' method achieves relatively high accuracy with lower time-to-answer values.
* The 'short-3@k' method shows a similar trend to 'short-1@k', but with slightly different accuracy values for the same time-to-answer.
* The 'short-1@k' and 'short-3@k' methods (Ours) generally outperform the 'majority@k' method in terms of accuracy for a given time-to-answer.
### Interpretation
The scatter plot visualizes the trade-off between accuracy and time-to-answer for different methods. The 'short-1@k' and 'short-3@k' methods appear to be more efficient, achieving higher accuracy with less time-to-answer compared to the 'majority@k' method. The parameter 'k' seems to influence the accuracy of each method, with higher 'k' values generally leading to better accuracy. The plot suggests that the 'Ours' methods are a potentially better approach.