## Chart: Answer Accuracy vs. Layer for Llama Models
### Overview
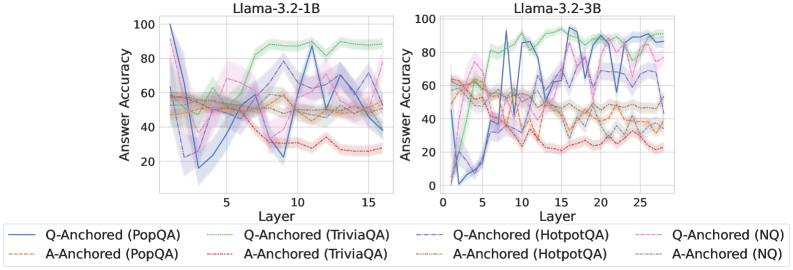
The image contains two line charts comparing the answer accuracy of Llama models (Llama-3.2-1B and Llama-3.2-3B) across different layers for various question-answering datasets. The charts show how accuracy changes as the model processes information through its layers. Each chart plots the answer accuracy (y-axis) against the layer number (x-axis) for six different configurations: Q-Anchored and A-Anchored for PopQA, TriviaQA, HotpotQA, and NQ datasets. Shaded regions around each line represent the uncertainty or variance in the accuracy.
### Components/Axes
**Left Chart (Llama-3.2-1B):**
* **Title:** Llama-3.2-1B
* **X-axis:** Layer, with ticks at 0, 5, 10, and 15.
* **Y-axis:** Answer Accuracy, ranging from 0 to 100, with ticks at 0, 20, 40, 60, 80, and 100.
**Right Chart (Llama-3.2-3B):**
* **Title:** Llama-3.2-3B
* **X-axis:** Layer, with ticks at 0, 5, 10, 15, 20, and 25.
* **Y-axis:** Answer Accuracy, ranging from 0 to 100, with ticks at 0, 20, 40, 60, 80, and 100.
**Legend (Located below both charts):**
* **Q-Anchored (PopQA):** Solid blue line
* **A-Anchored (PopQA):** Dashed brown line
* **Q-Anchored (TriviaQA):** Solid green line
* **A-Anchored (TriviaQA):** Dashed green line
* **Q-Anchored (HotpotQA):** Solid purple line
* **A-Anchored (HotpotQA):** Dashed purple line
* **Q-Anchored (NQ):** Dashed pink line
* **A-Anchored (NQ):** Dotted black line
### Detailed Analysis
**Llama-3.2-1B:**
* **Q-Anchored (PopQA):** Starts at approximately 100% accuracy at layer 0, drops sharply to around 20% by layer 5, then gradually increases to around 60% by layer 15.
* **A-Anchored (PopQA):** Relatively stable, fluctuating between 40% and 60% accuracy across all layers.
* **Q-Anchored (TriviaQA):** Starts around 50% accuracy, increases to approximately 90% by layer 10, and then slightly decreases to around 85% by layer 15.
* **A-Anchored (TriviaQA):** Relatively stable, fluctuating between 50% and 60% accuracy across all layers.
* **Q-Anchored (HotpotQA):** Starts around 60% accuracy, drops to approximately 30% by layer 5, and then increases to around 40% by layer 15.
* **A-Anchored (HotpotQA):** Relatively stable, fluctuating between 40% and 50% accuracy across all layers.
* **Q-Anchored (NQ):** Starts around 60% accuracy, drops to approximately 30% by layer 5, and then increases to around 30% by layer 15.
* **A-Anchored (NQ):** Relatively stable, fluctuating between 50% and 60% accuracy across all layers.
**Llama-3.2-3B:**
* **Q-Anchored (PopQA):** Starts at approximately 0% accuracy at layer 0, increases sharply to around 80% by layer 5, and then fluctuates between 70% and 90% accuracy across the remaining layers.
* **A-Anchored (PopQA):** Relatively stable, fluctuating between 40% and 60% accuracy across all layers.
* **Q-Anchored (TriviaQA):** Starts around 60% accuracy, increases to approximately 95% by layer 10, and then fluctuates between 80% and 95% by layer 25.
* **A-Anchored (TriviaQA):** Relatively stable, fluctuating between 50% and 60% accuracy across all layers.
* **Q-Anchored (HotpotQA):** Starts around 60% accuracy, drops to approximately 20% by layer 5, and then increases to around 40% by layer 25.
* **A-Anchored (HotpotQA):** Relatively stable, fluctuating between 40% and 50% accuracy across all layers.
* **Q-Anchored (NQ):** Starts around 60% accuracy, drops to approximately 20% by layer 5, and then increases to around 30% by layer 25.
* **A-Anchored (NQ):** Relatively stable, fluctuating between 50% and 60% accuracy across all layers.
### Key Observations
* **Initial Drop in Q-Anchored (PopQA) for Llama-3.2-1B:** The sharp decline in accuracy for Q-Anchored (PopQA) in the initial layers of Llama-3.2-1B is a notable anomaly.
* **Higher Accuracy for TriviaQA:** Both models show relatively high accuracy for TriviaQA, especially with Q-Anchoring.
* **Stable A-Anchored Performance:** A-Anchored configurations generally exhibit more stable performance across layers compared to Q-Anchored configurations.
* **Layer Impact:** The impact of layer depth on accuracy varies significantly depending on the dataset and anchoring method.
* **Model Size Impact:** The 3B model generally achieves higher accuracy and stability compared to the 1B model, especially for Q-Anchored (PopQA).
### Interpretation
The charts illustrate the performance of Llama models on different question-answering tasks, highlighting the impact of model size, layer depth, and anchoring method on answer accuracy. The initial drop in Q-Anchored (PopQA) for Llama-3.2-1B suggests that the model may initially struggle with this specific task before learning to improve accuracy in later layers. The higher accuracy for TriviaQA indicates that the models are better suited for this type of question-answering. The stable performance of A-Anchored configurations suggests that anchoring the answer provides more consistent results across layers. The improved accuracy and stability of the 3B model compared to the 1B model demonstrate the benefits of increasing model size. Overall, the data suggests that the choice of dataset, anchoring method, and model size can significantly impact the performance of Llama models on question-answering tasks.